Every card below answers one question our projects can answer, drawn as a publication-grade chart with the source printed on it. Download the PNG, post it anywhere.
Numbers are computed from the publishers' open datasets and checked against the project pipelines. The fine print travels with the chart.
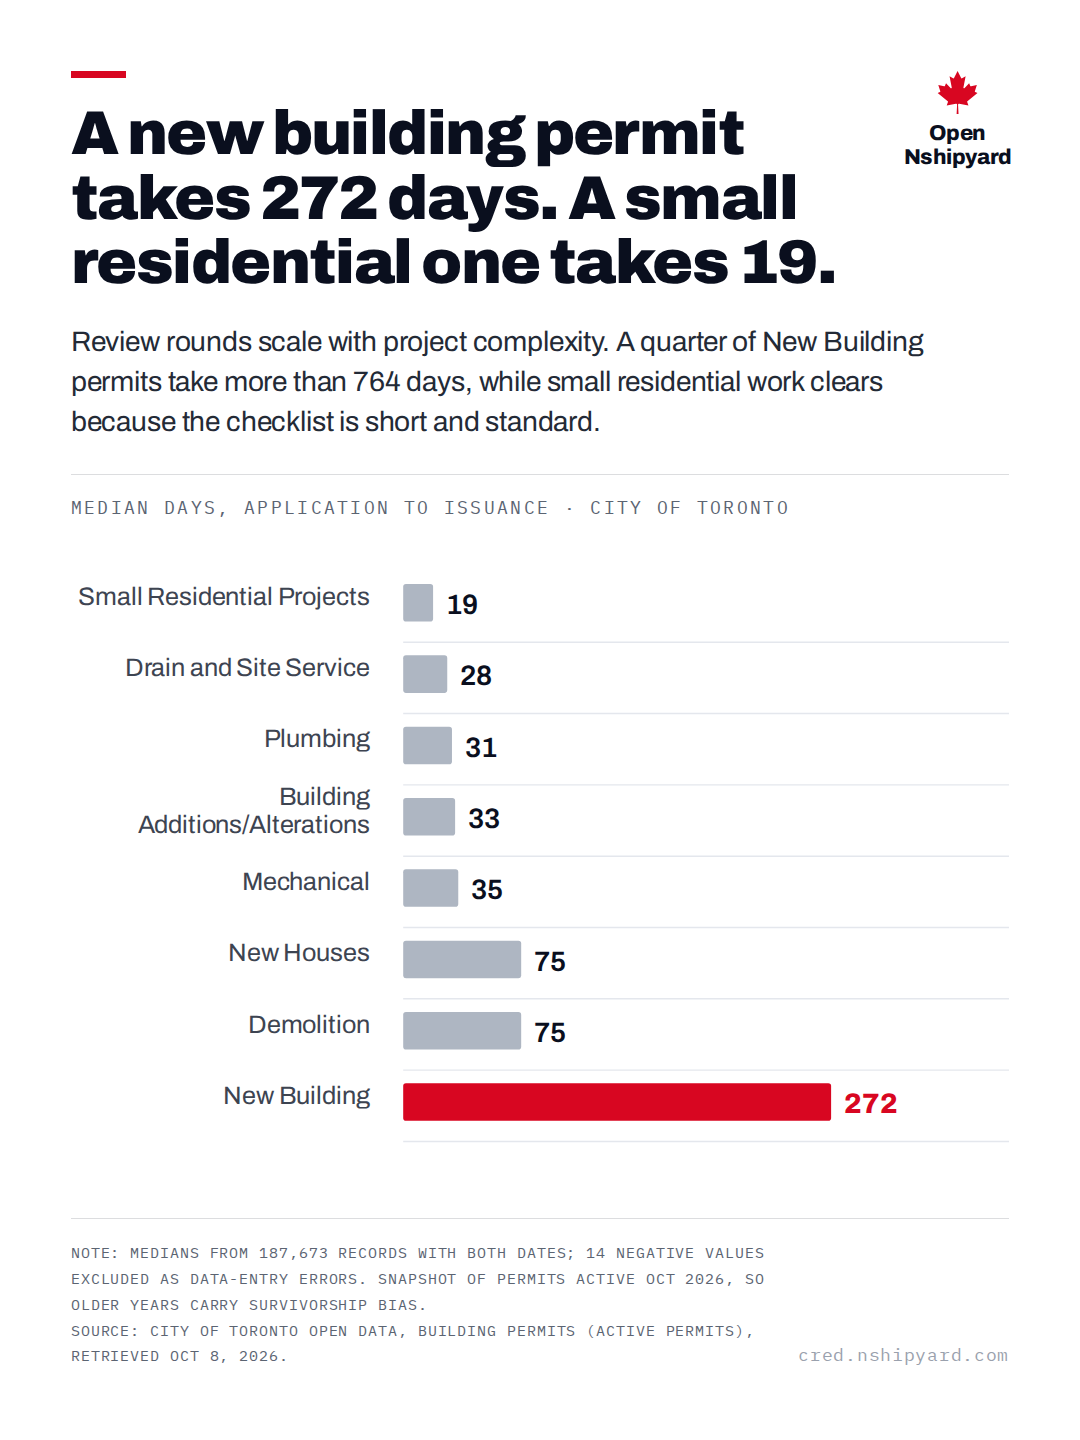
A new building permit takes 272 days. A small residential one takes 19.
Open Nshipyard
Review rounds scale with project complexity. A quarter of New Building permits take more than 764 days, while small residential work clears because the checklist is short and standard.
Median days, application to issuance · City of Toronto
Note: Medians from 187,673 records with both dates; 14 negative values excluded as data-entry errors. Snapshot of permits active Oct 2026, so older years carry survivorship bias. Source: City of Toronto open data, Building Permits (Active Permits), retrieved Oct 8, 2026.
toronto-development-pipeline.vercel.app
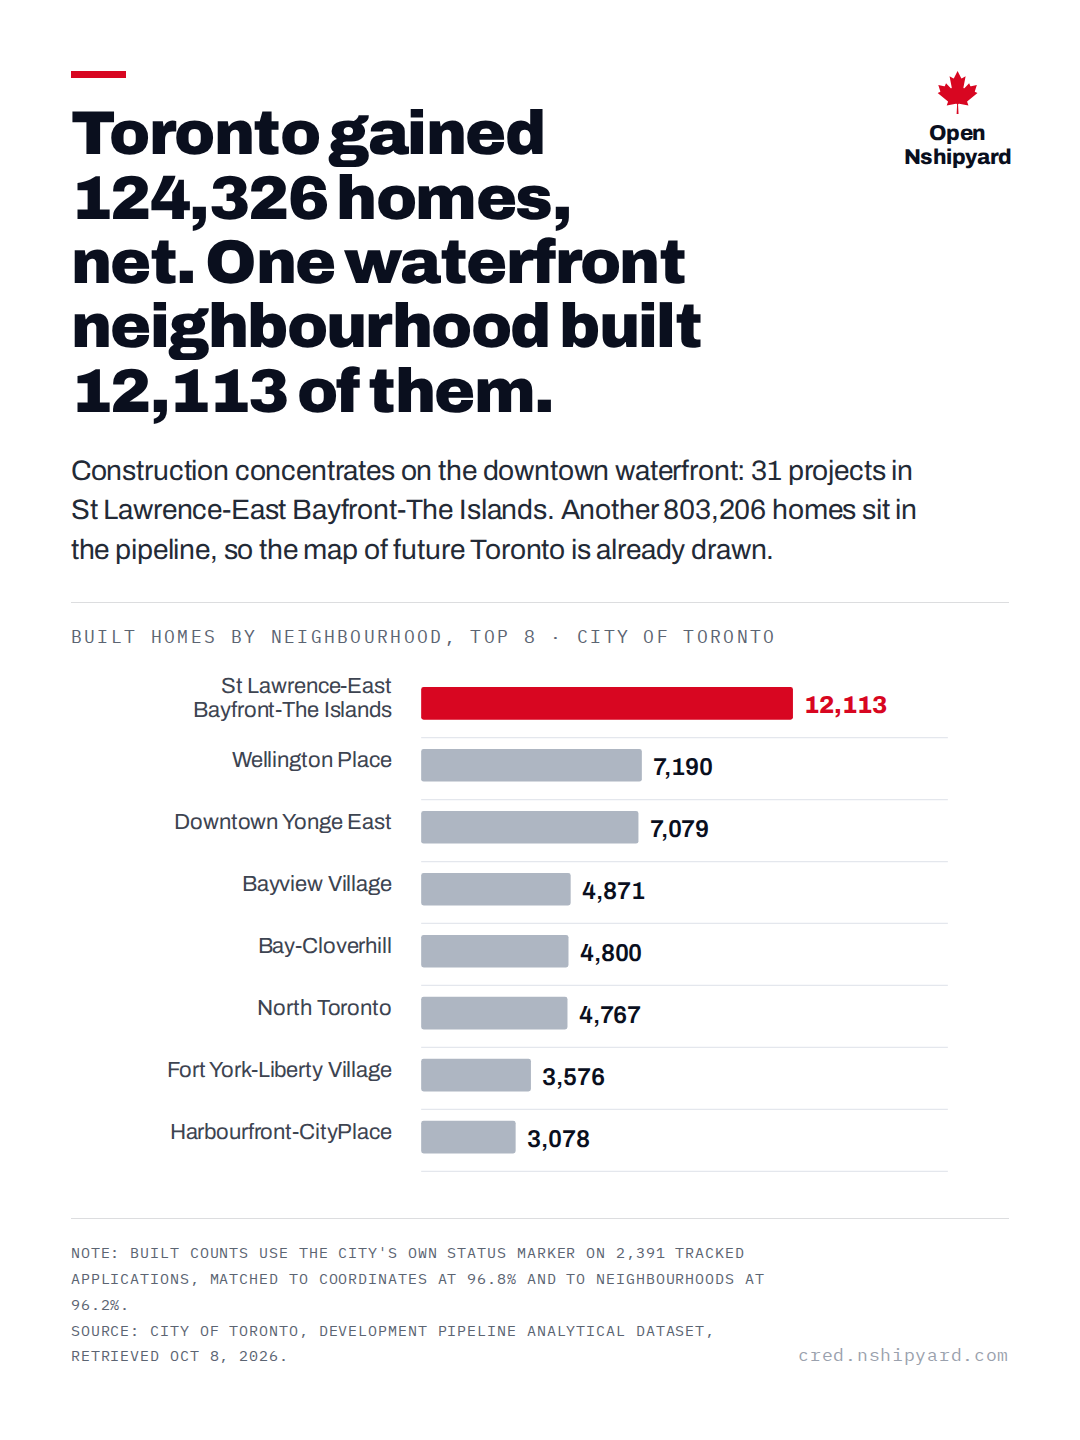
Toronto gained 124,326 homes, net. One waterfront neighbourhood built 12,113 of them.
Open Nshipyard
Construction concentrates on the downtown waterfront: 31 projects in St Lawrence-East Bayfront-The Islands. Another 803,206 homes sit in the pipeline, so the map of future Toronto is already drawn.
Built homes by neighbourhood, top 8 · City of Toronto
Note: Built counts use the City's own status marker on 2,391 tracked applications, matched to coordinates at 96.8% and to neighbourhoods at 96.2%. Source: City of Toronto, Development Pipeline analytical dataset, retrieved Oct 8, 2026.
toronto-development-pipeline.vercel.app
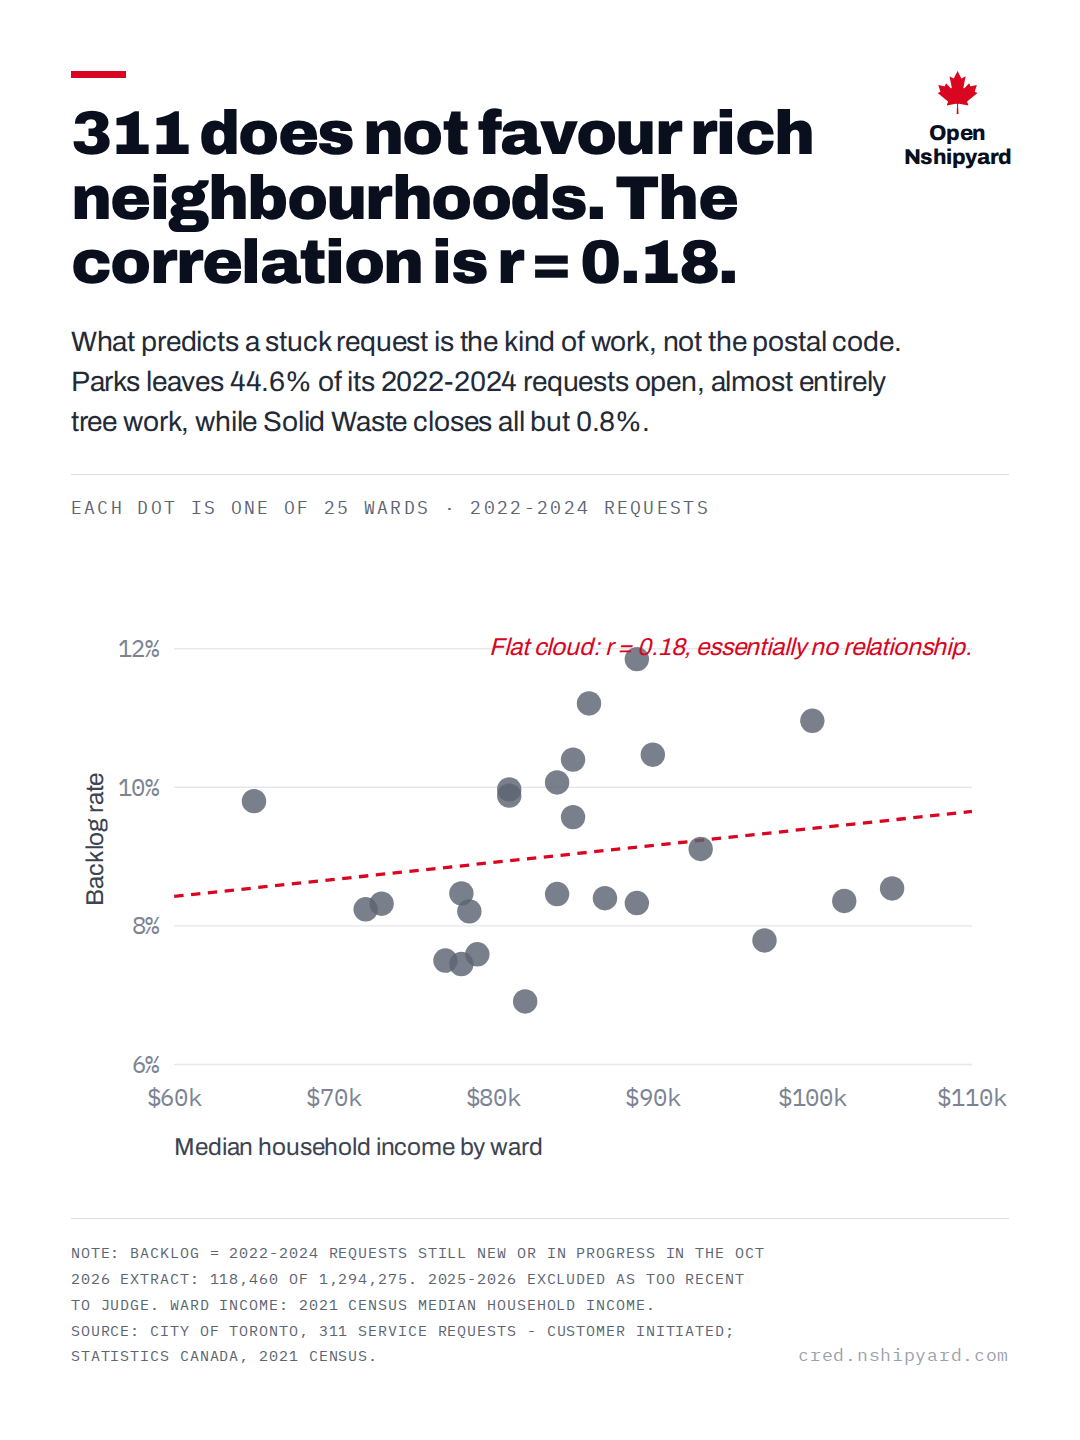
311 does not favour rich neighbourhoods. The correlation is r = 0.18.
Open Nshipyard
What predicts a stuck request is the kind of work, not the postal code. Parks leaves 44.6% of its 2022-2024 requests open, almost entirely tree work, while Solid Waste closes all but 0.8%.
Each dot is one of 25 wards · 2022-2024 requests
Note: Backlog = 2022-2024 requests still New or In Progress in the Oct 2026 extract: 118,460 of 1,294,275. 2025-2026 excluded as too recent to judge. Ward income: 2021 Census median household income. Source: City of Toronto, 311 Service Requests - Customer Initiated; Statistics Canada, 2021 Census.
toronto-311-taxonomy.vercel.app
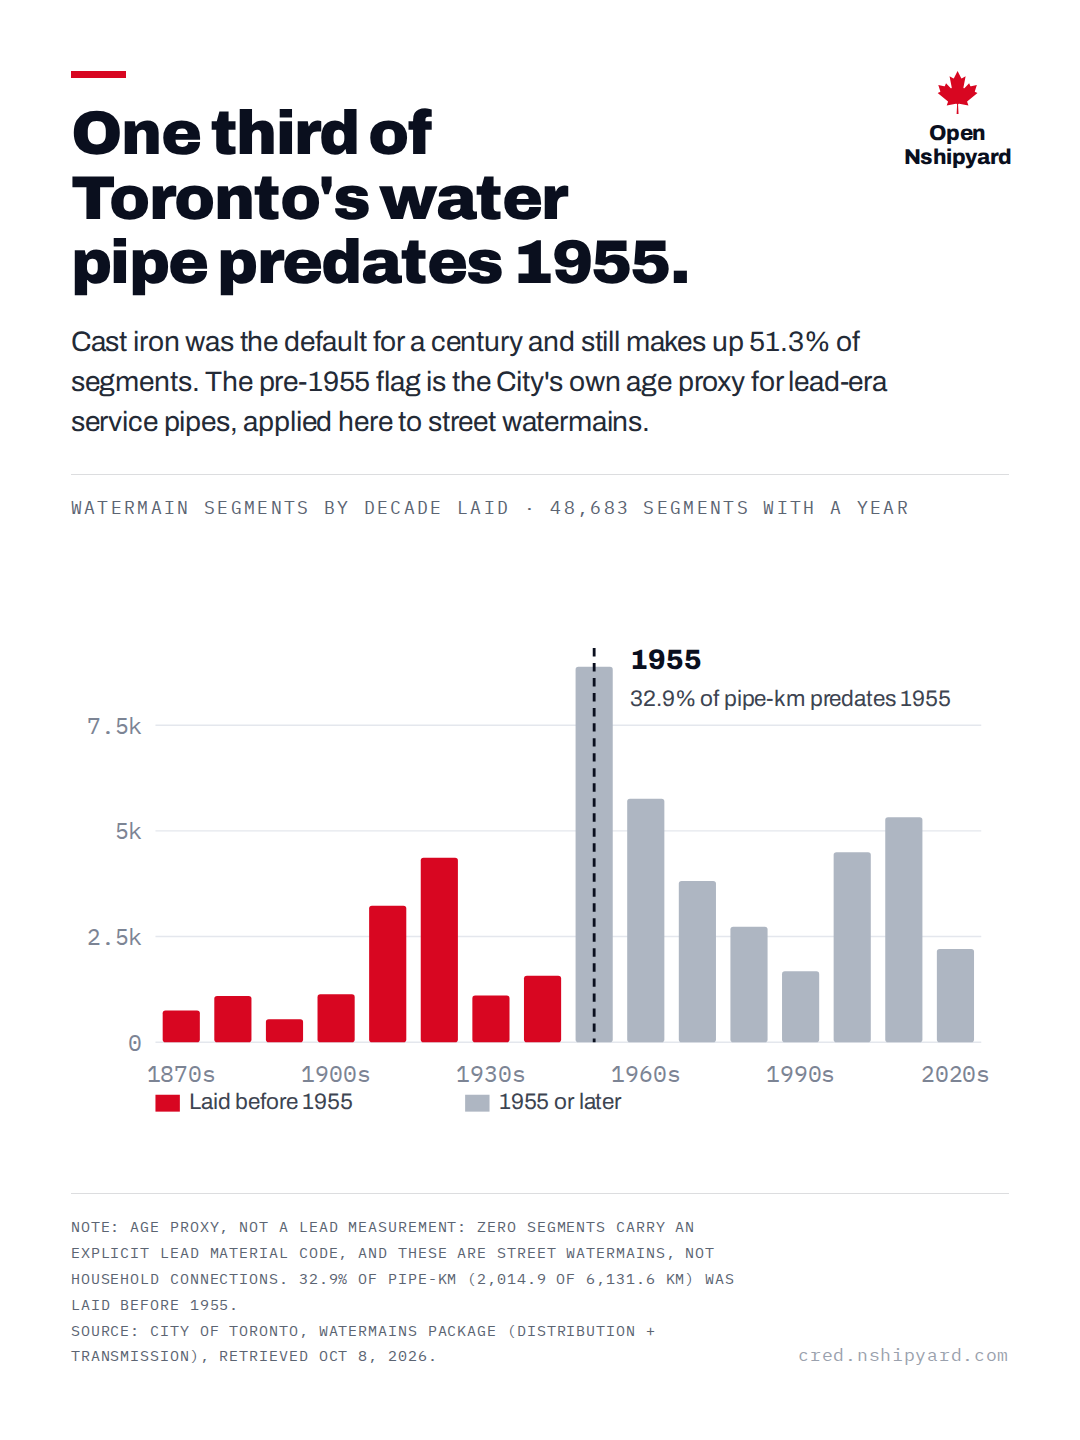
One third of Toronto's water pipe predates 1955.
Open Nshipyard
Cast iron was the default for a century and still makes up 51.3% of segments. The pre-1955 flag is the City's own age proxy for lead-era service pipes, applied here to street watermains.
Watermain segments by decade laid · 48,683 segments with a year
Note: Age proxy, not a lead measurement: zero segments carry an explicit lead material code, and these are street watermains, not household connections. 32.9% of pipe-km (2,014.9 of 6,131.6 km) was laid before 1955. Source: City of Toronto, Watermains package (distribution + transmission), retrieved Oct 8, 2026.
toronto-watermain-codebook.vercel.app
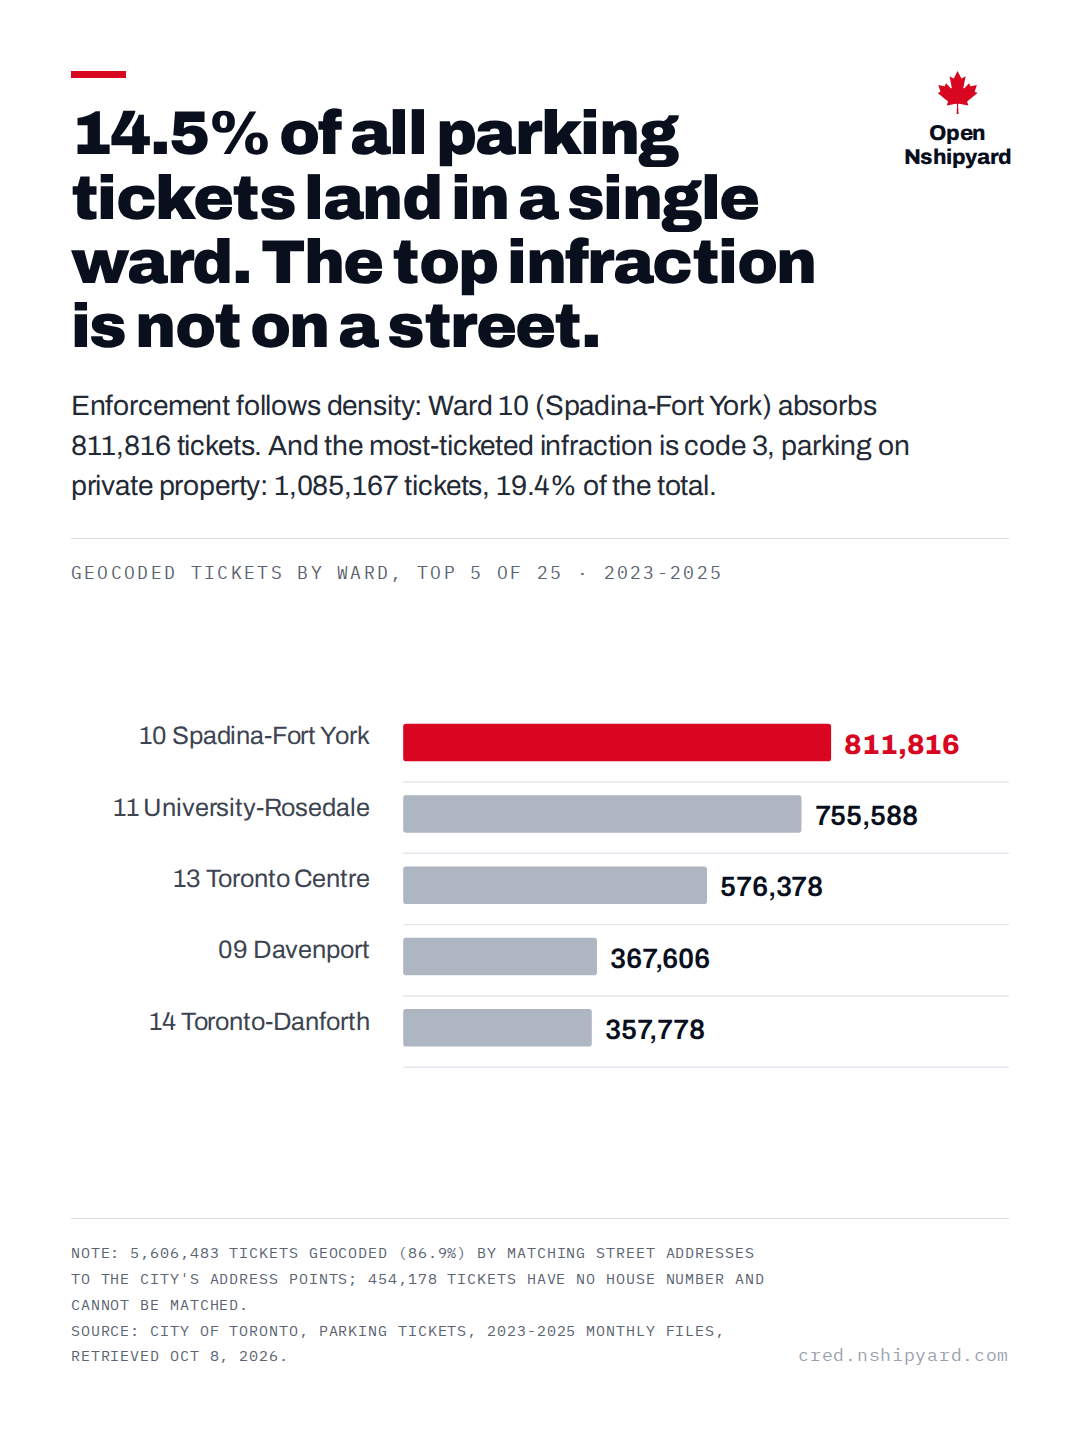
14.5% of all parking tickets land in a single ward. The top infraction is not on a street.
Open Nshipyard
Enforcement follows density: Ward 10 (Spadina-Fort York) absorbs 811,816 tickets. And the most-ticketed infraction is code 3, parking on private property: 1,085,167 tickets, 19.4% of the total.
Geocoded tickets by ward, top 5 of 25 · 2023-2025
Note: 5,606,483 tickets geocoded (86.9%) by matching street addresses to the City's Address Points; 454,178 tickets have no house number and cannot be matched. Source: City of Toronto, Parking Tickets, 2023-2025 monthly files, retrieved Oct 8, 2026.
toronto-parking-tickets-geocoded.vercel.app
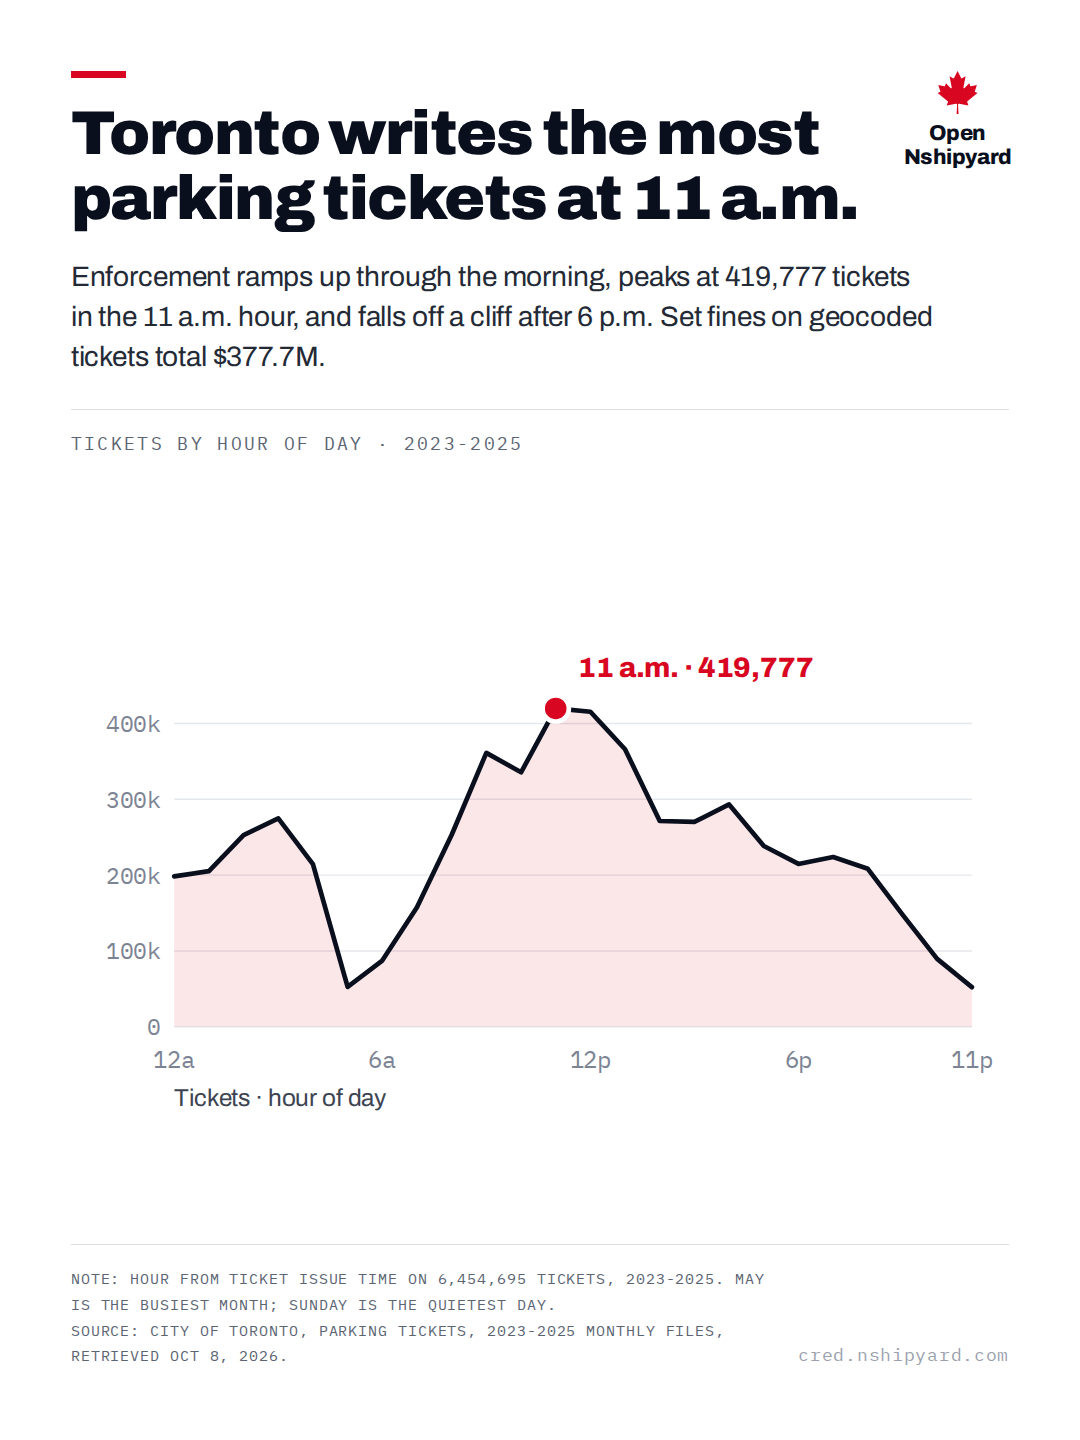
Toronto writes the most parking tickets at 11 a.m.
Open Nshipyard
Enforcement ramps up through the morning, peaks at 419,777 tickets in the 11 a.m. hour, and falls off a cliff after 6 p.m. Set fines on geocoded tickets total $377.7M.
Tickets by hour of day · 2023-2025
Note: Hour from ticket issue time on 6,454,695 tickets, 2023-2025. May is the busiest month; Sunday is the quietest day. Source: City of Toronto, Parking Tickets, 2023-2025 monthly files, retrieved Oct 8, 2026.
toronto-parking-tickets-geocoded.vercel.app
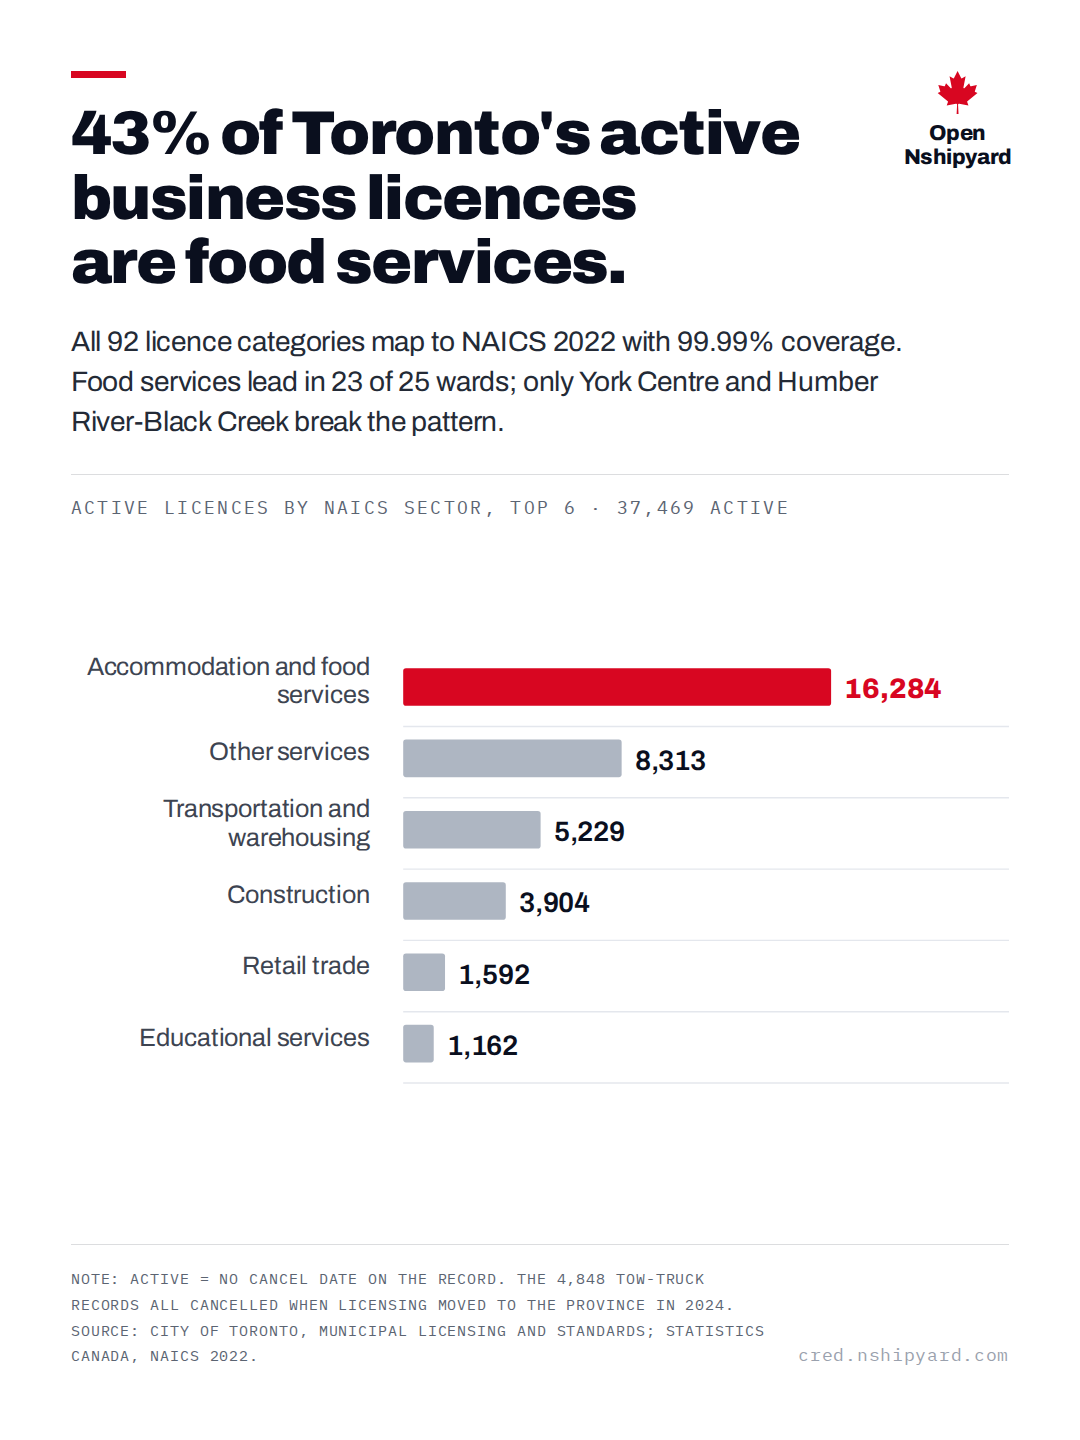
43% of Toronto's active business licences are food services.
Open Nshipyard
All 92 licence categories map to NAICS 2022 with 99.99% coverage. Food services lead in 23 of 25 wards; only York Centre and Humber River-Black Creek break the pattern.
Active licences by NAICS sector, top 6 · 37,469 active
Note: Active = no cancel date on the record. The 4,848 tow-truck records all cancelled when licensing moved to the province in 2024. Source: City of Toronto, Municipal Licensing and Standards; Statistics Canada, NAICS 2022.
toronto-licence-naics.vercel.app
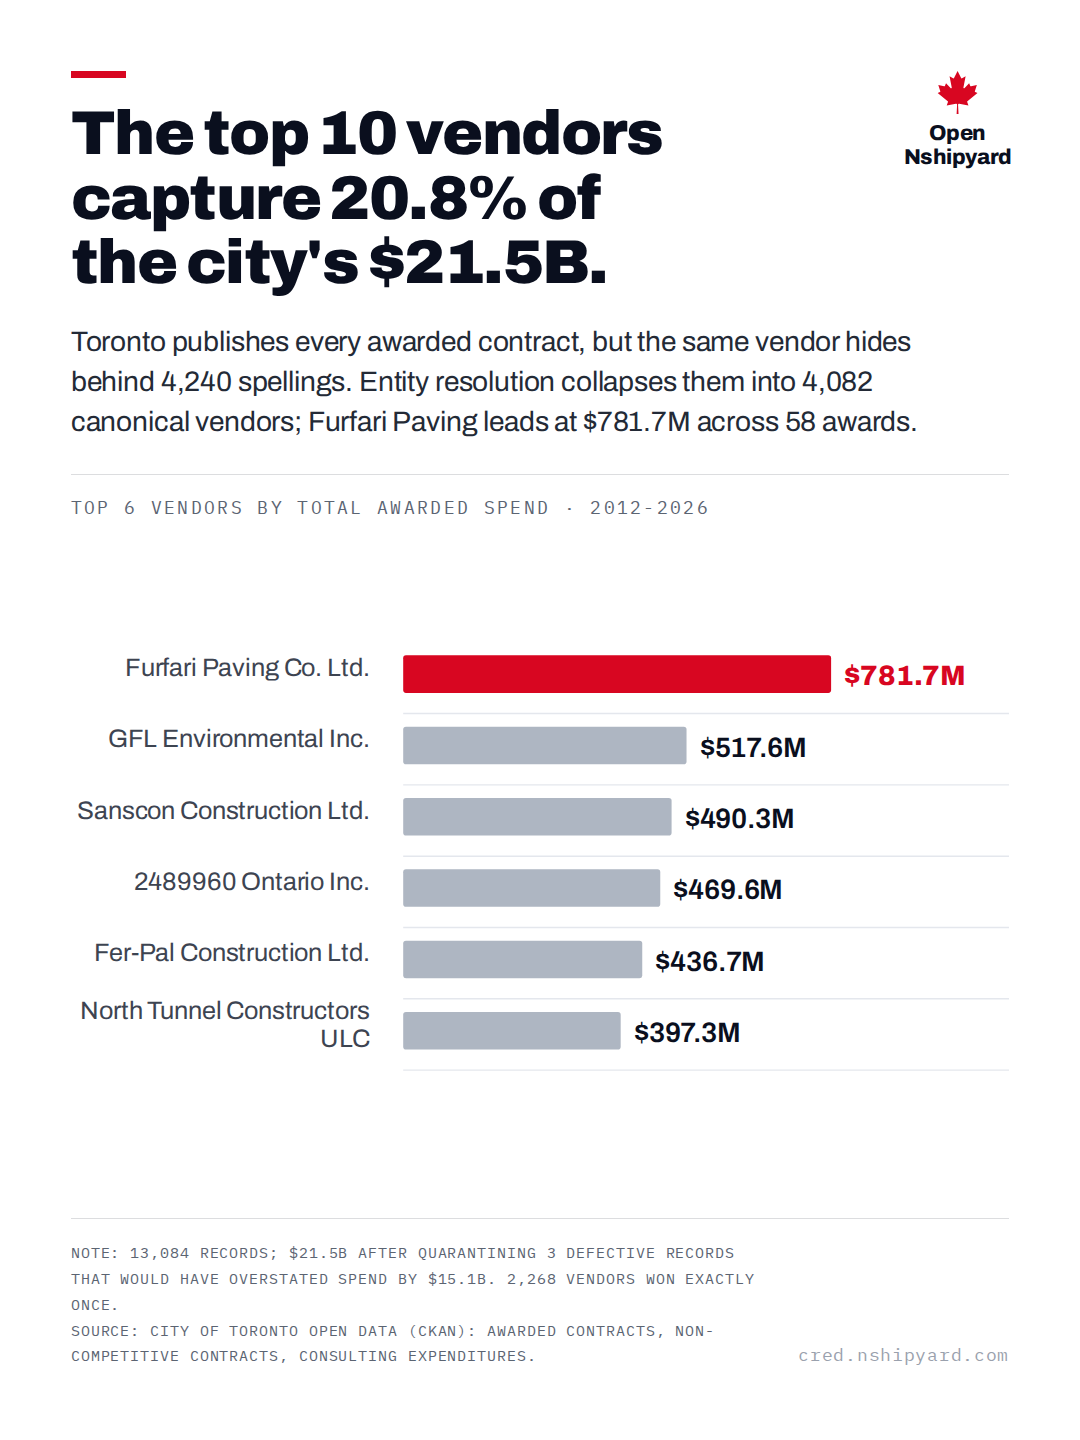
The top 10 vendors capture 20.8% of the city's $21.5B.
Open Nshipyard
Toronto publishes every awarded contract, but the same vendor hides behind 4,240 spellings. Entity resolution collapses them into 4,082 canonical vendors; Furfari Paving leads at $781.7M across 58 awards.
Top 6 vendors by total awarded spend · 2012-2026
Note: 13,084 records; $21.5B after quarantining 3 defective records that would have overstated spend by $15.1B. 2,268 vendors won exactly once. Source: City of Toronto Open Data (CKAN): awarded contracts, non-competitive contracts, consulting expenditures.
procurement.canada.nshipyard.com
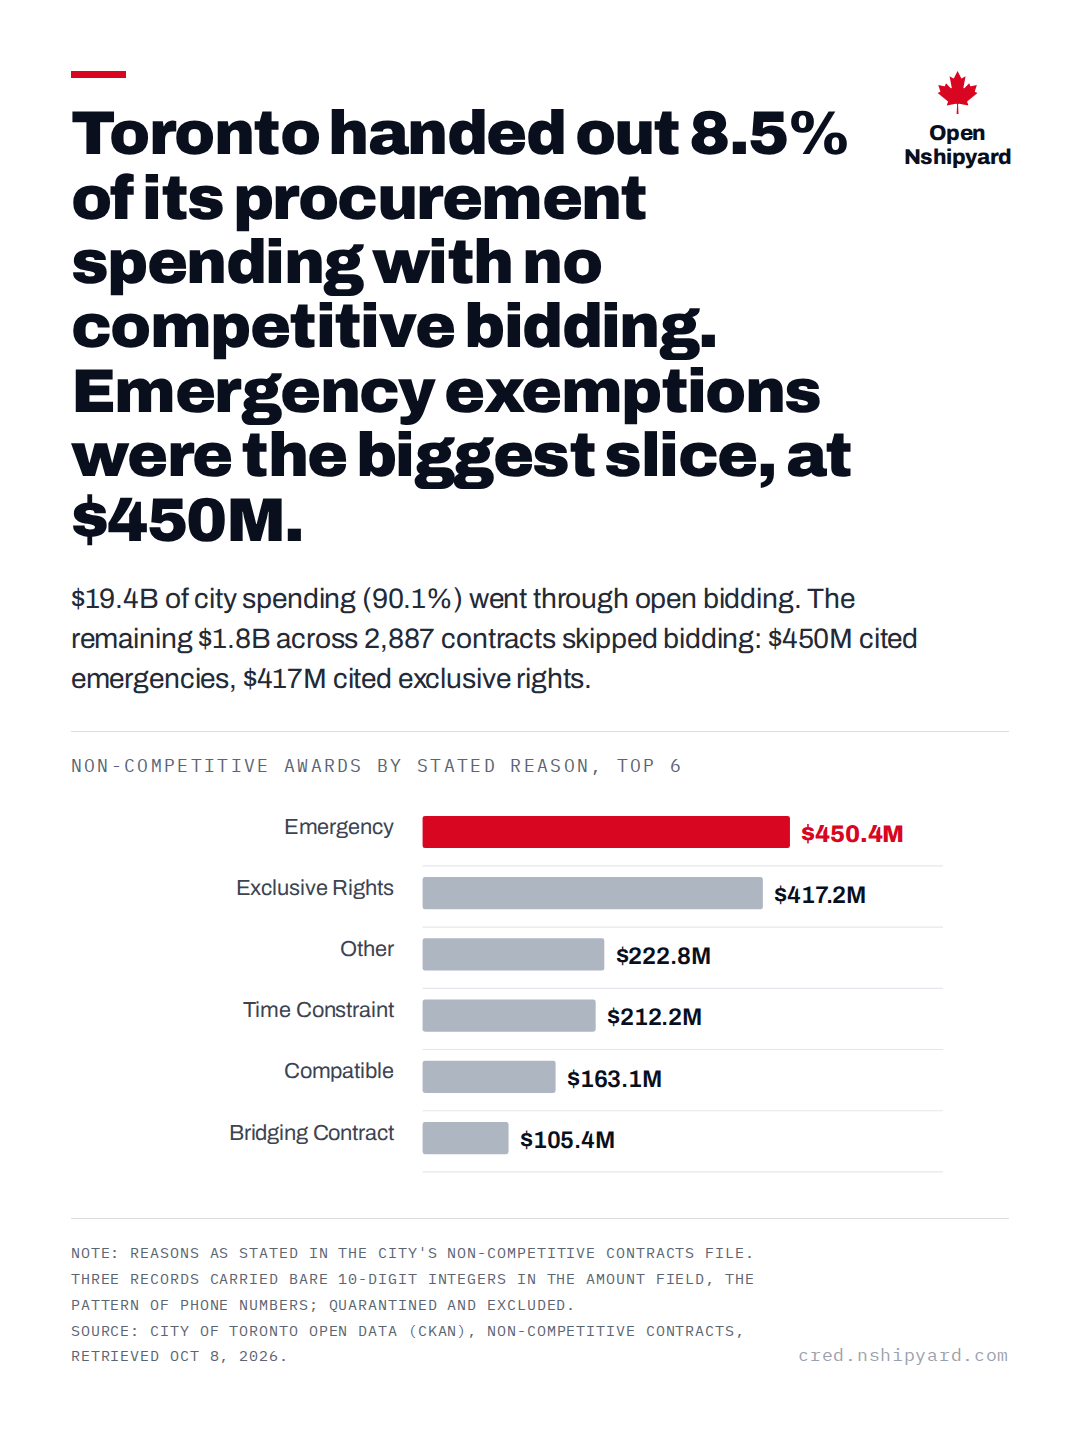
Toronto handed out 8.5% of its procurement spending with no competitive bidding. Emergency exemptions were the biggest slice, at $450M.
Open Nshipyard
$19.4B of city spending (90.1%) went through open bidding. The remaining $1.8B across 2,887 contracts skipped bidding: $450M cited emergencies, $417M cited exclusive rights.
Non-competitive awards by stated reason, top 6
Note: Reasons as stated in the City's non-competitive contracts file. Three records carried bare 10-digit integers in the amount field, the pattern of phone numbers; quarantined and excluded. Source: City of Toronto Open Data (CKAN), Non-Competitive Contracts, retrieved Oct 8, 2026.
procurement.canada.nshipyard.com
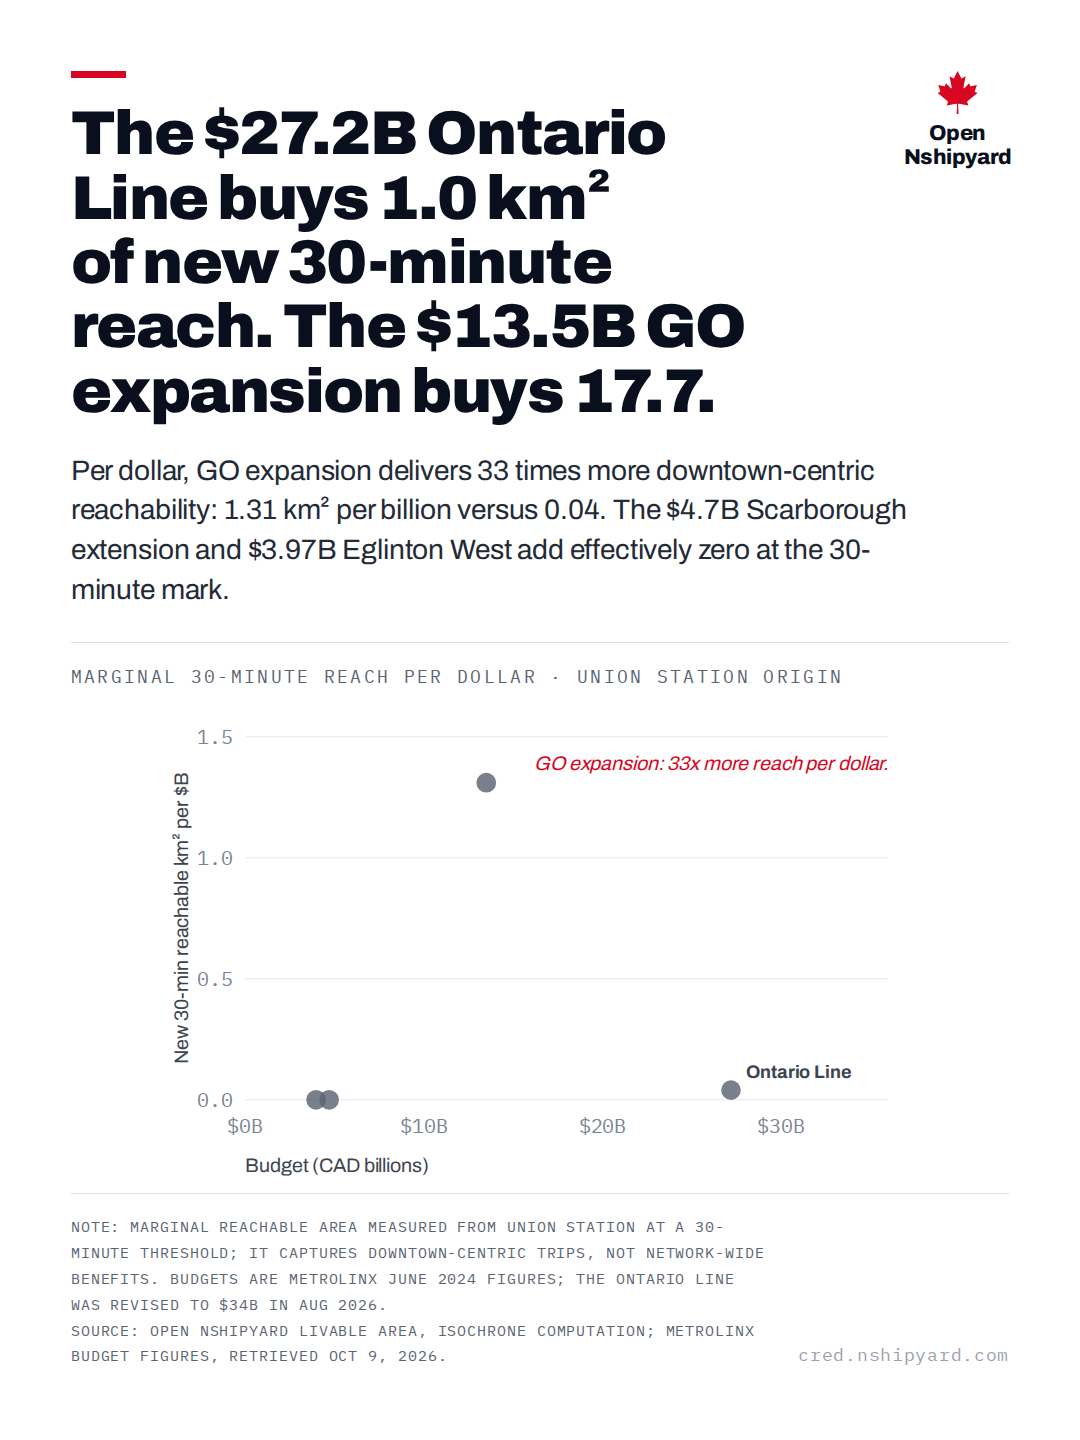
The $27.2B Ontario Line buys 1.0 km² of new 30-minute reach. The $13.5B GO expansion buys 17.7.
Open Nshipyard
Per dollar, GO expansion delivers 33 times more downtown-centric reachability: 1.31 km² per billion versus 0.04. The $4.7B Scarborough extension and $3.97B Eglinton West add effectively zero at the 30-minute mark.
Marginal 30-minute reach per dollar · Union Station origin
Note: Marginal reachable area measured from Union Station at a 30-minute threshold; it captures downtown-centric trips, not network-wide benefits. Budgets are Metrolinx June 2024 figures; the Ontario Line was revised to $34B in Aug 2026. Source: Open Nshipyard Livable Area, isochrone computation; Metrolinx budget figures, retrieved Oct 9, 2026.
livable.canada.nshipyard.com
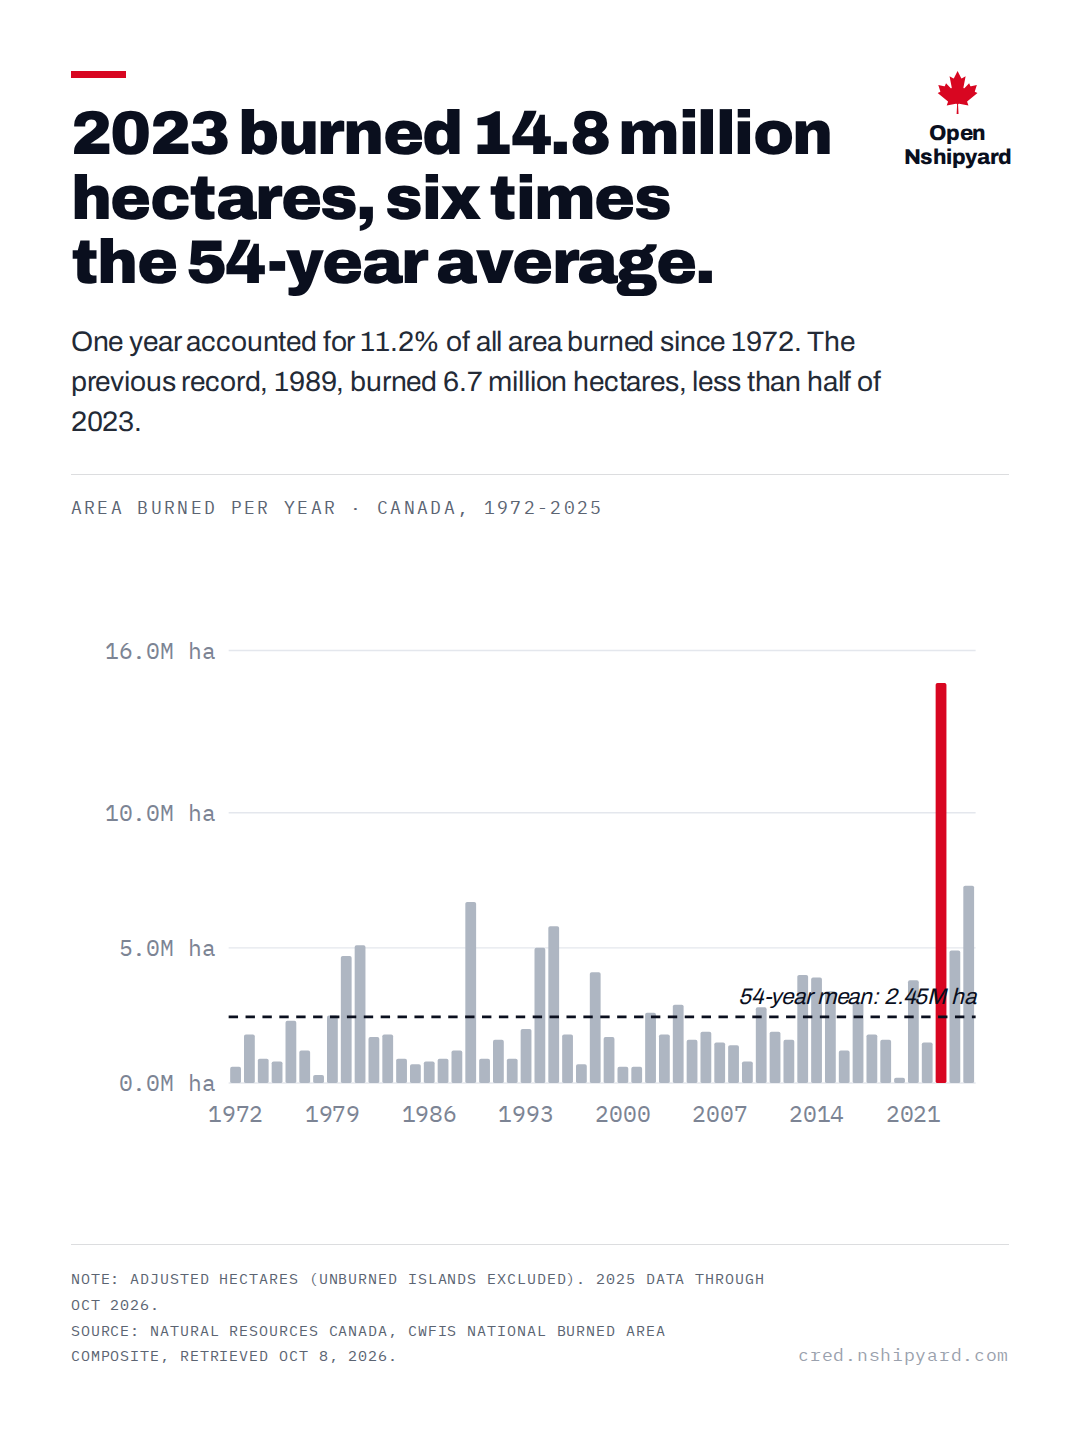
2023 burned 14.8 million hectares, six times the 54-year average.
Open Nshipyard
One year accounted for 11.2% of all area burned since 1972. The previous record, 1989, burned 6.7 million hectares, less than half of 2023.
Area burned per year · Canada, 1972-2025
Note: Adjusted hectares (unburned islands excluded). 2025 data through Oct 2026. Source: Natural Resources Canada, CWFIS National Burned Area Composite, retrieved Oct 8, 2026.
fire.canada.nshipyard.com
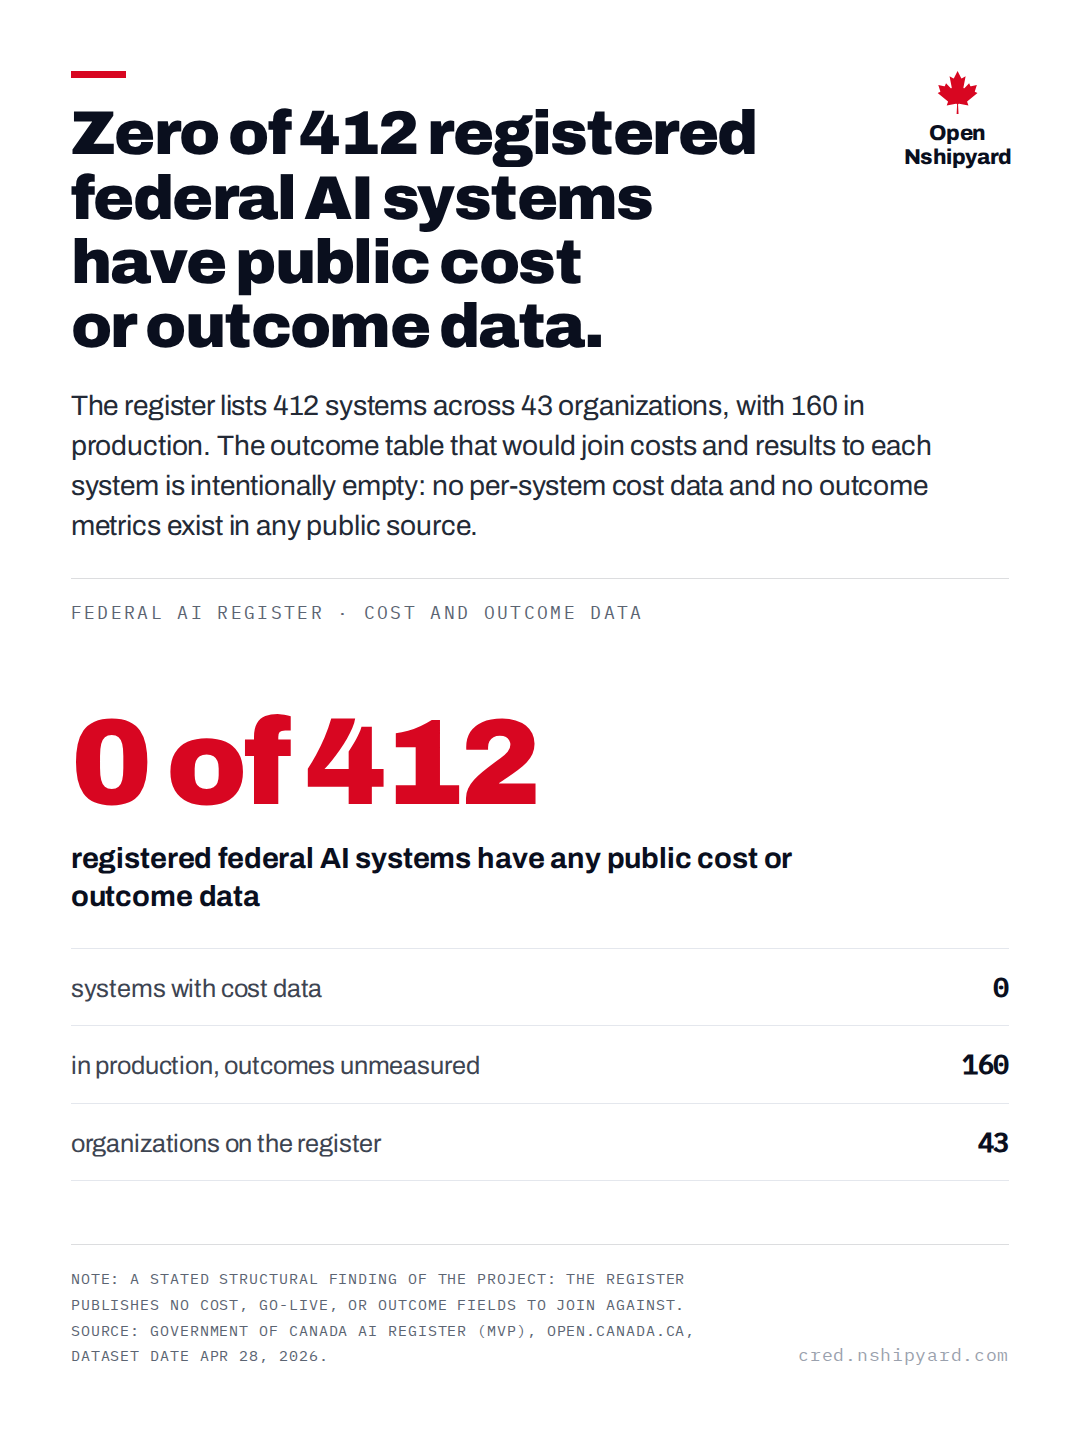
Zero of 412 registered federal AI systems have public cost or outcome data.
Open Nshipyard
The register lists 412 systems across 43 organizations, with 160 in production. The outcome table that would join costs and results to each system is intentionally empty: no per-system cost data and no outcome metrics exist in any public source.
Federal AI register · cost and outcome data
0 of 412
registered federal AI systems have any public cost or outcome data
systems with cost data0
in production, outcomes unmeasured160
organizations on the register43
Note: A stated structural finding of the project: the register publishes no cost, go-live, or outcome fields to join against. Source: Government of Canada AI Register (MVP), open.canada.ca, dataset date Apr 28, 2026.
canada.nshipyard.com
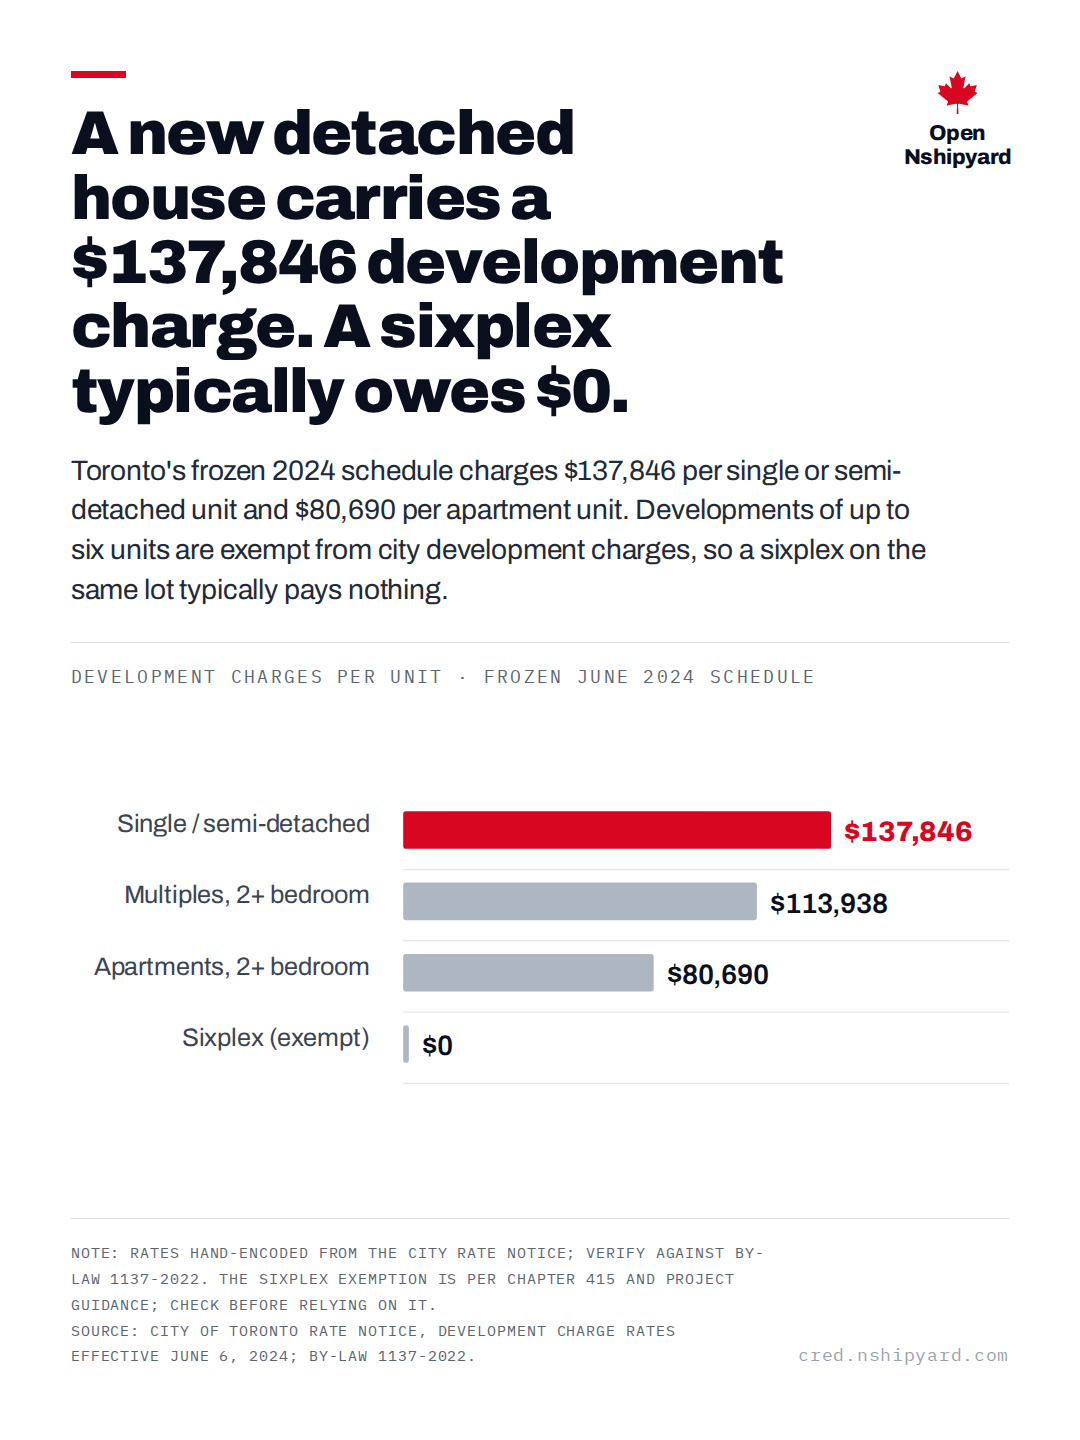
A new detached house carries a $137,846 development charge. A sixplex typically owes $0.
Open Nshipyard
Toronto's frozen 2024 schedule charges $137,846 per single or semi-detached unit and $80,690 per apartment unit. Developments of up to six units are exempt from city development charges, so a sixplex on the same lot typically pays nothing.
Development charges per unit · frozen June 2024 schedule
Note: Rates hand-encoded from the City rate notice; verify against By-law 1137-2022. The sixplex exemption is per Chapter 415 and project guidance; check before relying on it. Source: City of Toronto rate notice, Development Charge Rates Effective June 6, 2024; By-law 1137-2022.
buildcheck.nshipyard.com
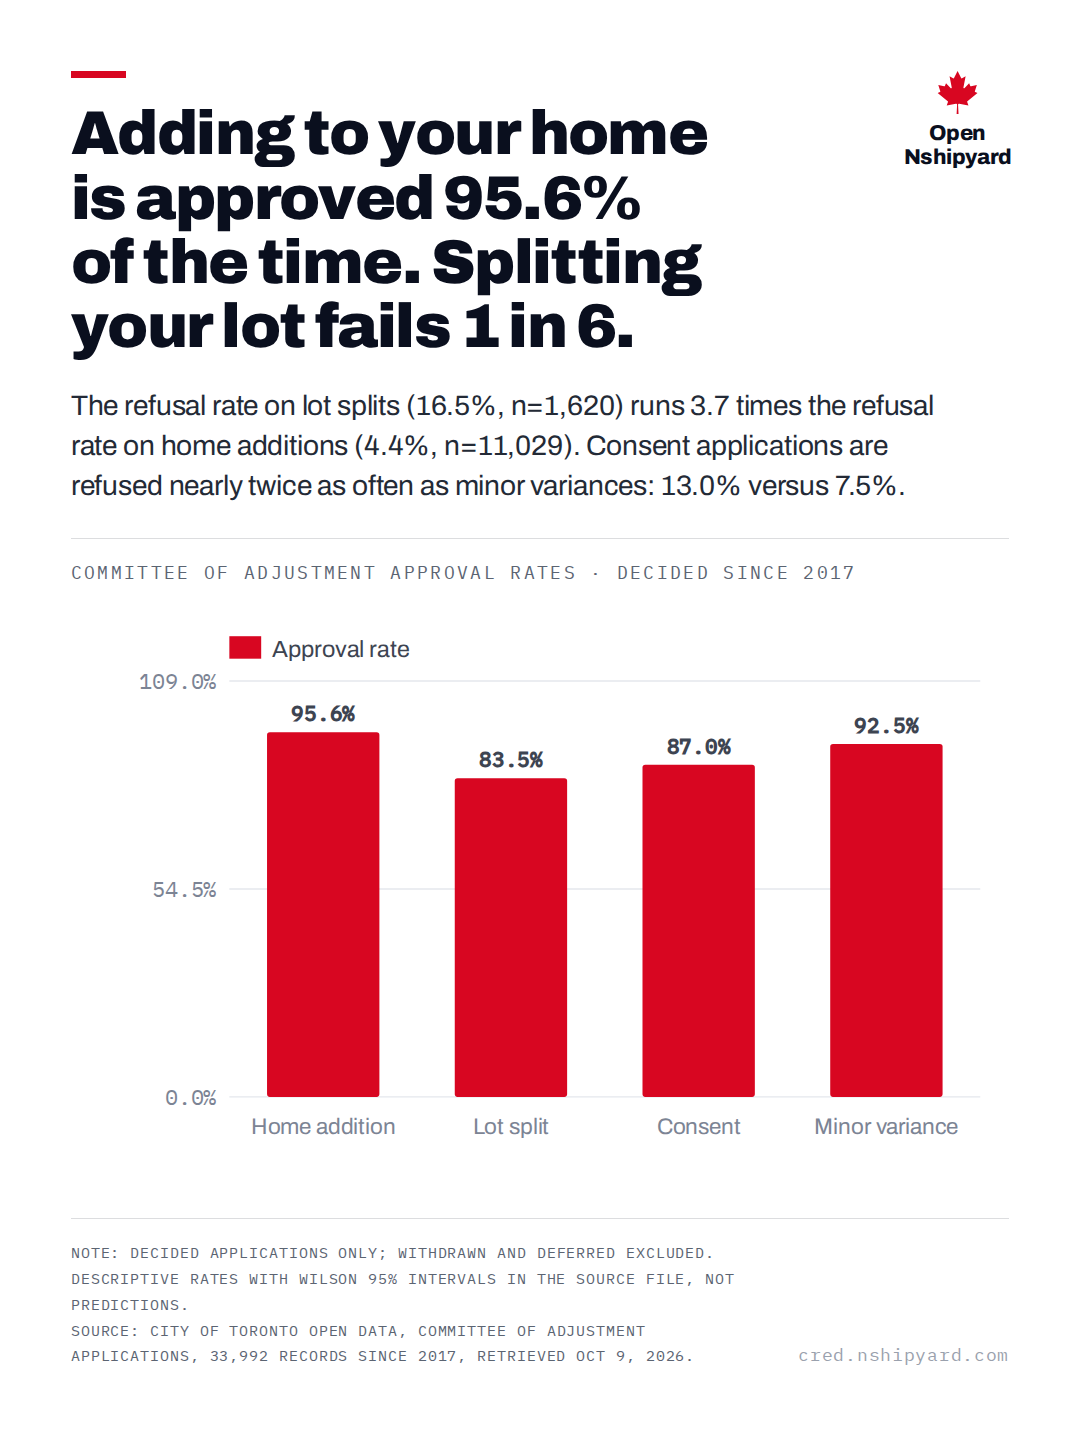
Adding to your home is approved 95.6% of the time. Splitting your lot fails 1 in 6.
Open Nshipyard
The refusal rate on lot splits (16.5%, n=1,620) runs 3.7 times the refusal rate on home additions (4.4%, n=11,029). Consent applications are refused nearly twice as often as minor variances: 13.0% versus 7.5%.
Committee of Adjustment approval rates · decided since 2017
Note: Decided applications only; withdrawn and deferred excluded. Descriptive rates with Wilson 95% intervals in the source file, not predictions. Source: City of Toronto open data, Committee of Adjustment Applications, 33,992 records since 2017, retrieved Oct 9, 2026.
buildcheck.nshipyard.com
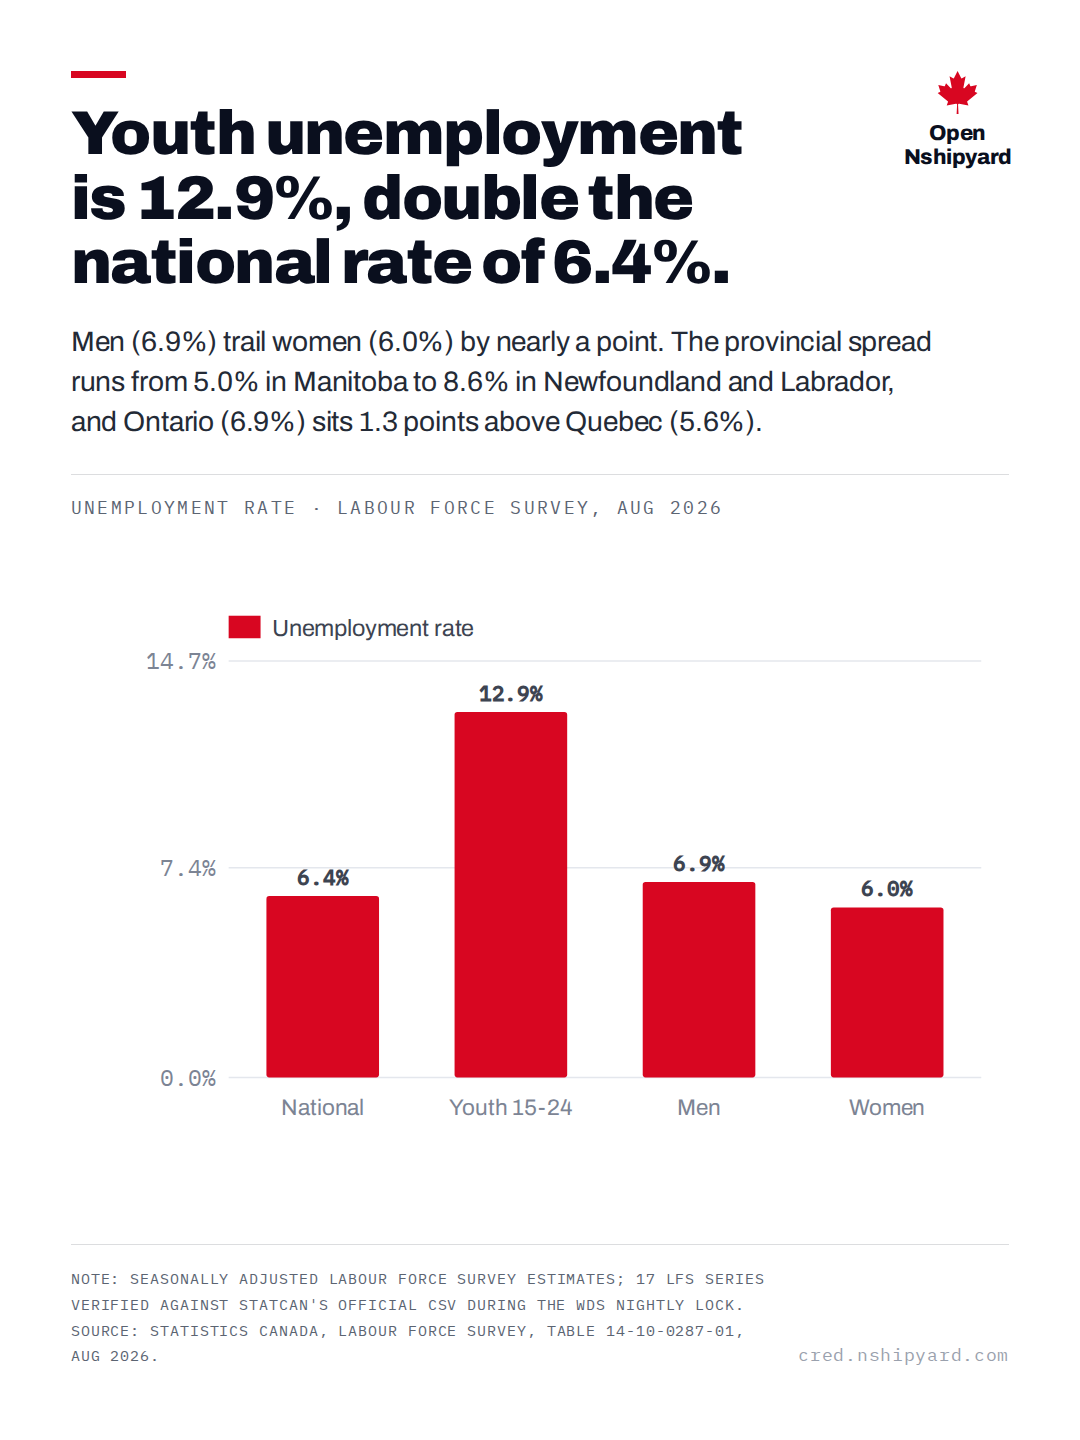
Youth unemployment is 12.9%, double the national rate of 6.4%.
Open Nshipyard
Men (6.9%) trail women (6.0%) by nearly a point. The provincial spread runs from 5.0% in Manitoba to 8.6% in Newfoundland and Labrador, and Ontario (6.9%) sits 1.3 points above Quebec (5.6%).
Unemployment rate · Labour Force Survey, Aug 2026
Note: Seasonally adjusted Labour Force Survey estimates; 17 LFS series verified against StatCan's official CSV during the WDS nightly lock. Source: Statistics Canada, Labour Force Survey, table 14-10-0287-01, Aug 2026.
canada.nshipyard.com
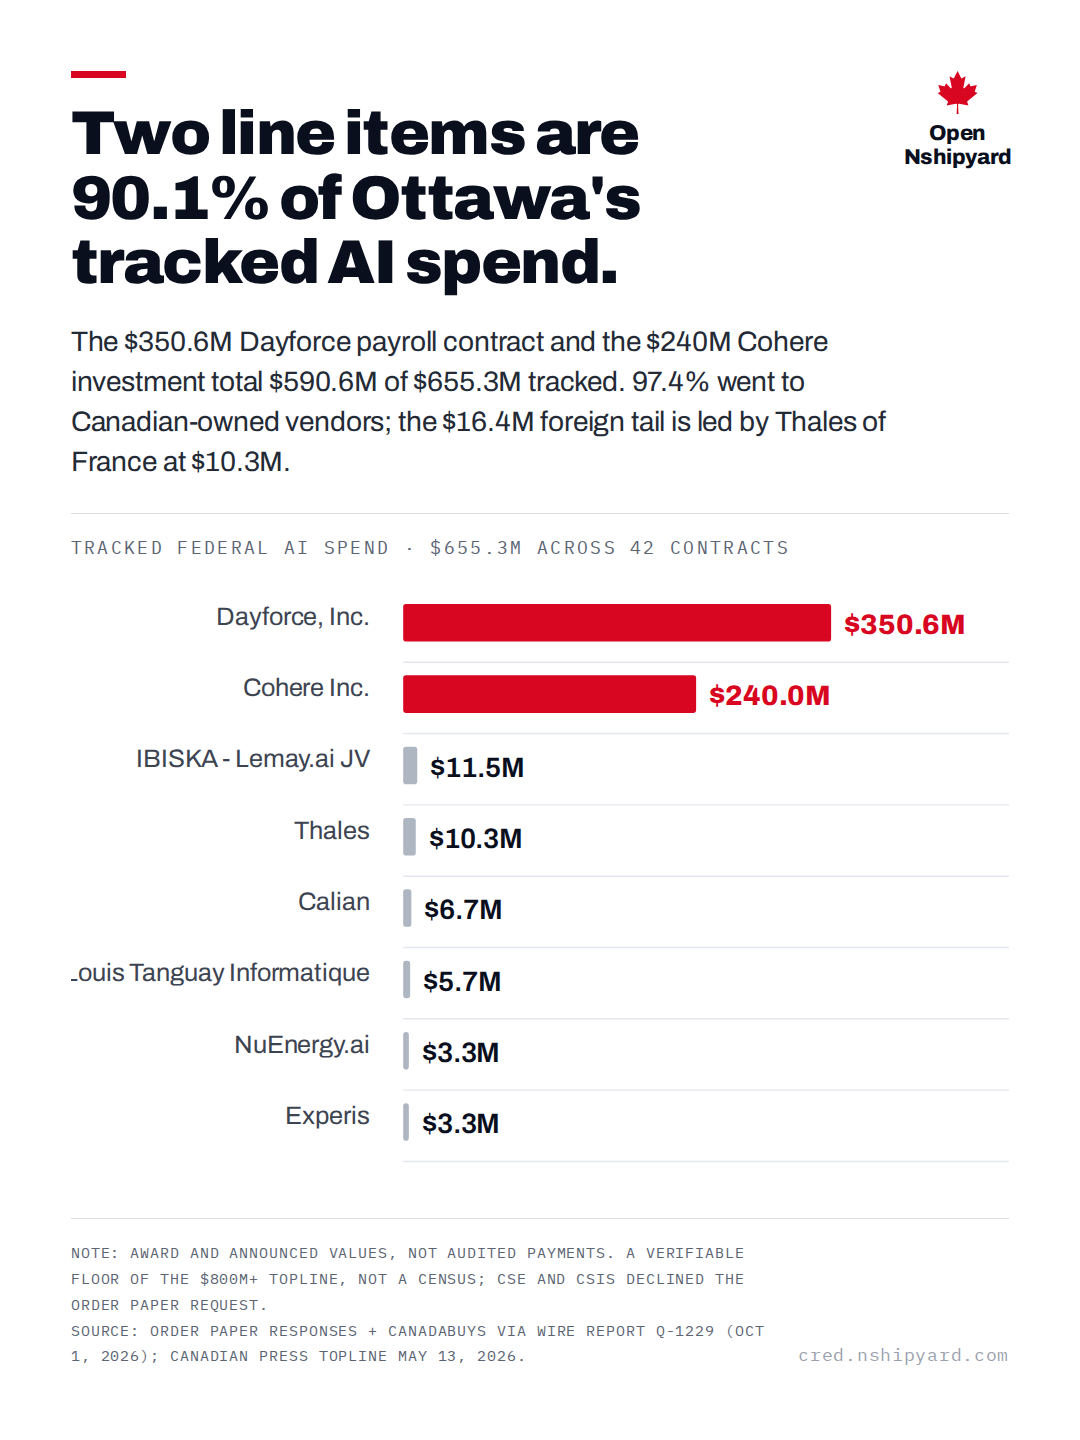
Two line items are 90.1% of Ottawa's tracked AI spend.
Open Nshipyard
The $350.6M Dayforce payroll contract and the $240M Cohere investment total $590.6M of $655.3M tracked. 97.4% went to Canadian-owned vendors; the $16.4M foreign tail is led by Thales of France at $10.3M.
Tracked federal AI spend · $655.3M across 42 contracts
Note: Award and announced values, not audited payments. A verifiable floor of the $800M+ topline, not a census; CSE and CSIS declined the Order Paper request. Source: Order Paper responses + CanadaBuys via Wire Report Q-1229 (Oct 1, 2026); Canadian Press topline May 13, 2026.
canada.nshipyard.com
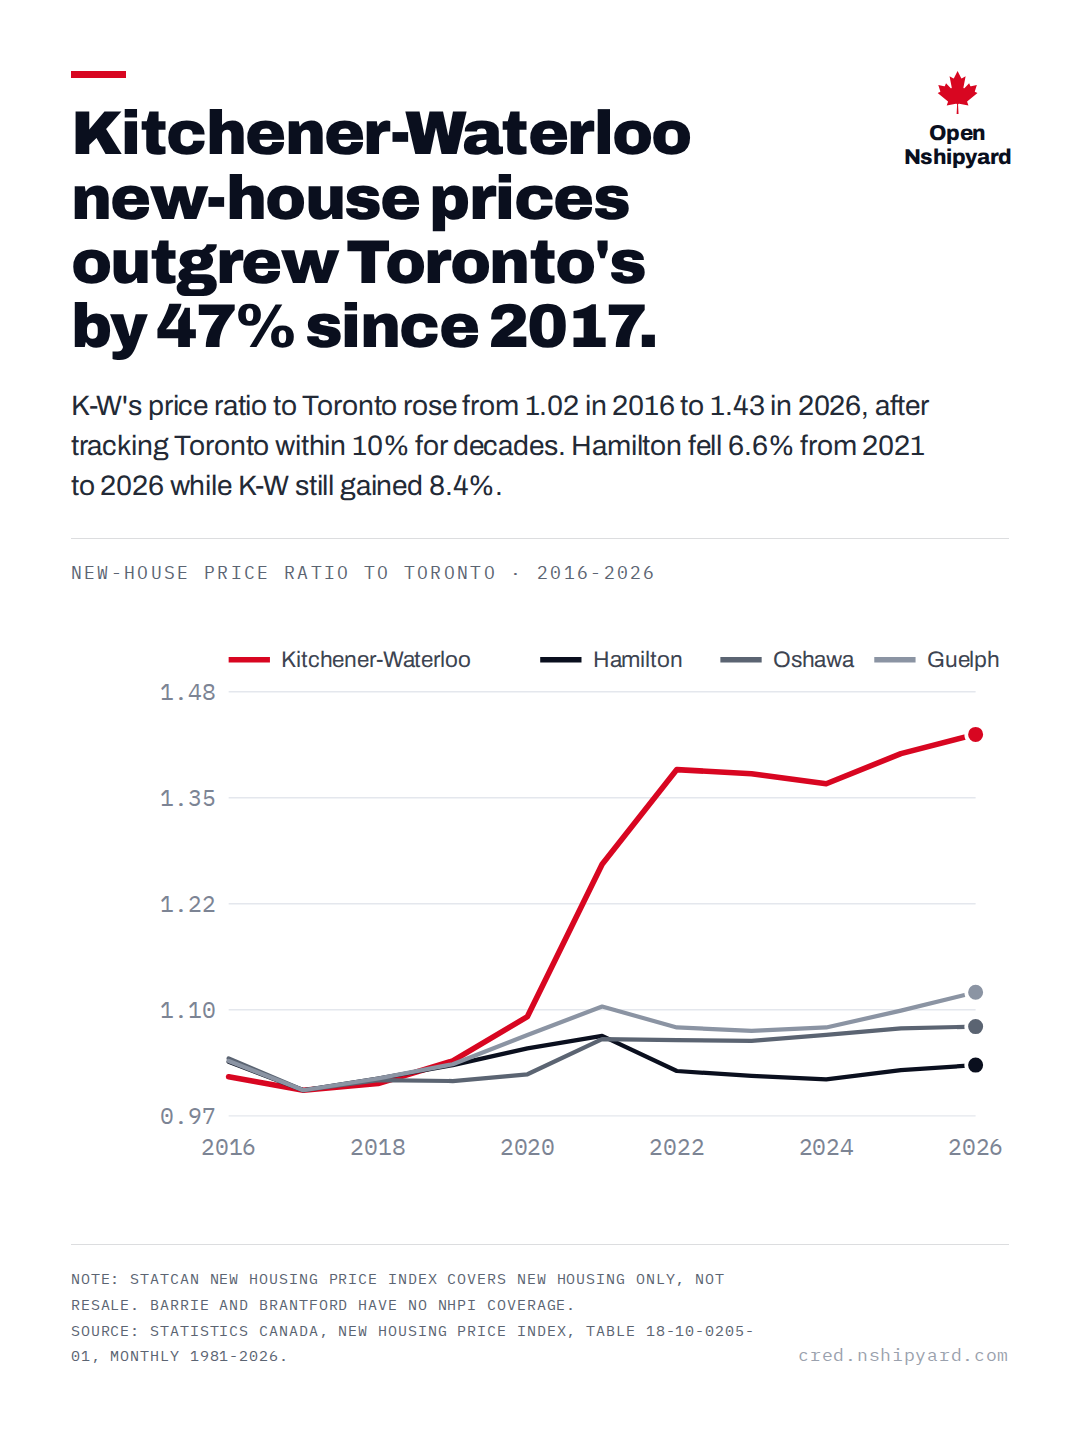
Kitchener-Waterloo new-house prices outgrew Toronto's by 47% since 2017.
Open Nshipyard
K-W's price ratio to Toronto rose from 1.02 in 2016 to 1.43 in 2026, after tracking Toronto within 10% for decades. Hamilton fell 6.6% from 2021 to 2026 while K-W still gained 8.4%.
New-house price ratio to Toronto · 2016-2026
Note: StatCan New Housing Price Index covers new housing only, not resale. Barrie and Brantford have no NHPI coverage. Source: Statistics Canada, New Housing Price Index, table 18-10-0205-01, monthly 1981-2026.
pricewave.canada.nshipyard.com
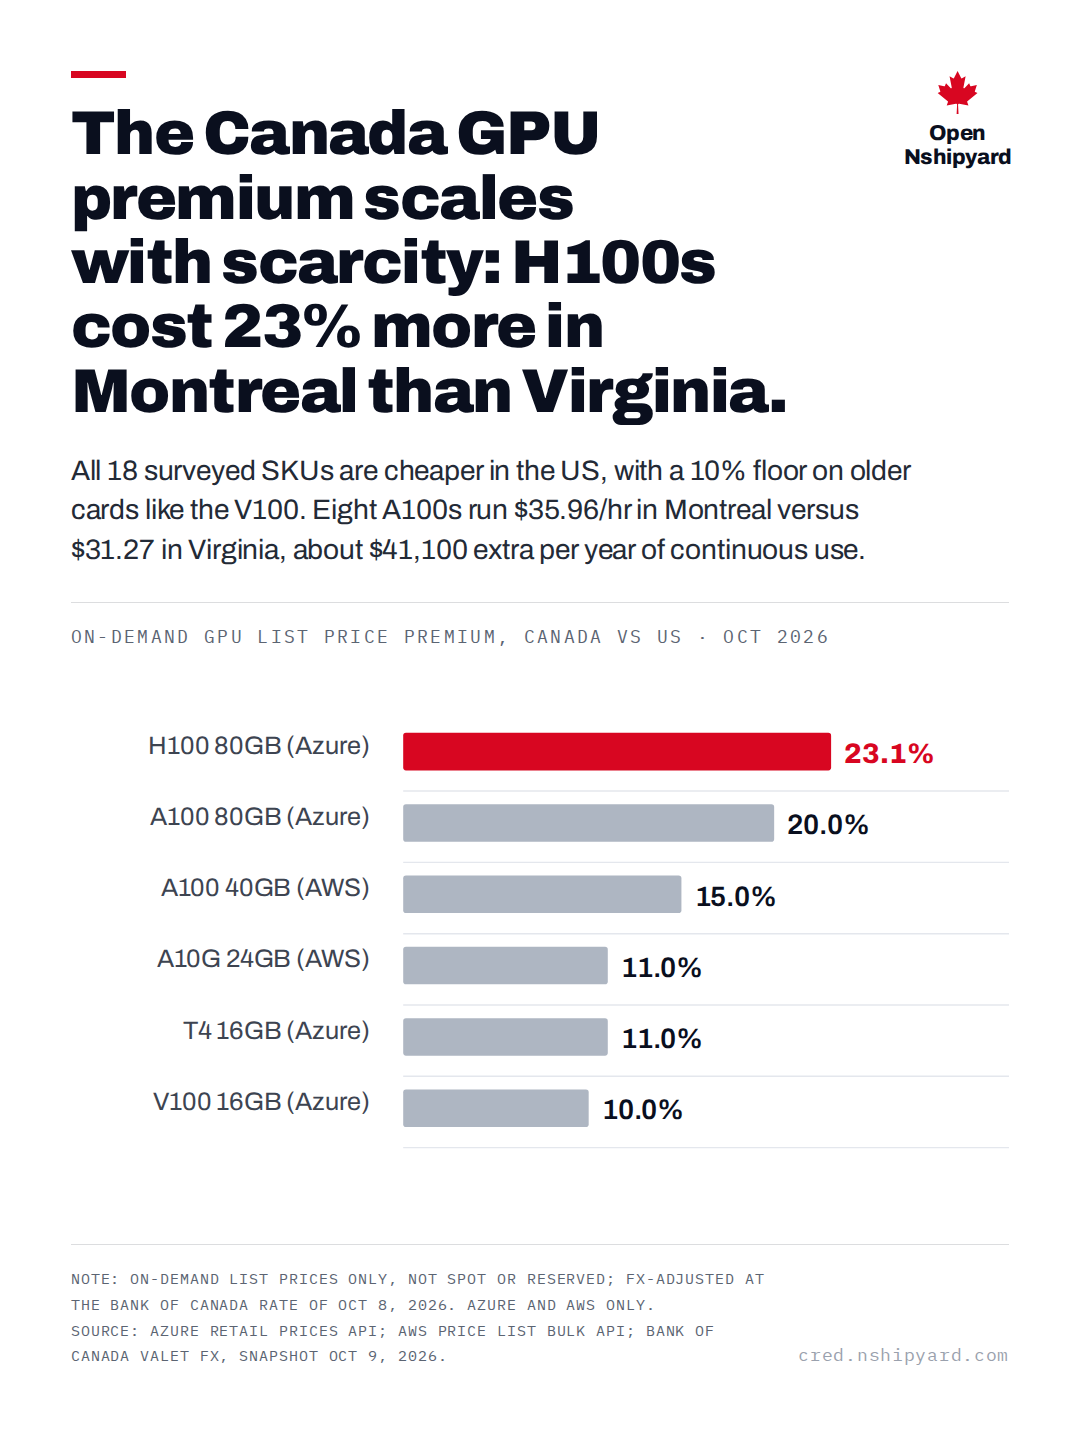
The Canada GPU premium scales with scarcity: H100s cost 23% more in Montreal than Virginia.
Open Nshipyard
All 18 surveyed SKUs are cheaper in the US, with a 10% floor on older cards like the V100. Eight A100s run $35.96/hr in Montreal versus $31.27 in Virginia, about $41,100 extra per year of continuous use.
On-demand GPU list price premium, Canada vs US · Oct 2026
Note: On-demand list prices only, not spot or reserved; FX-adjusted at the Bank of Canada rate of Oct 8, 2026. Azure and AWS only. Source: Azure Retail Prices API; AWS Price List Bulk API; Bank of Canada Valet FX, snapshot Oct 9, 2026.
canada.nshipyard.com
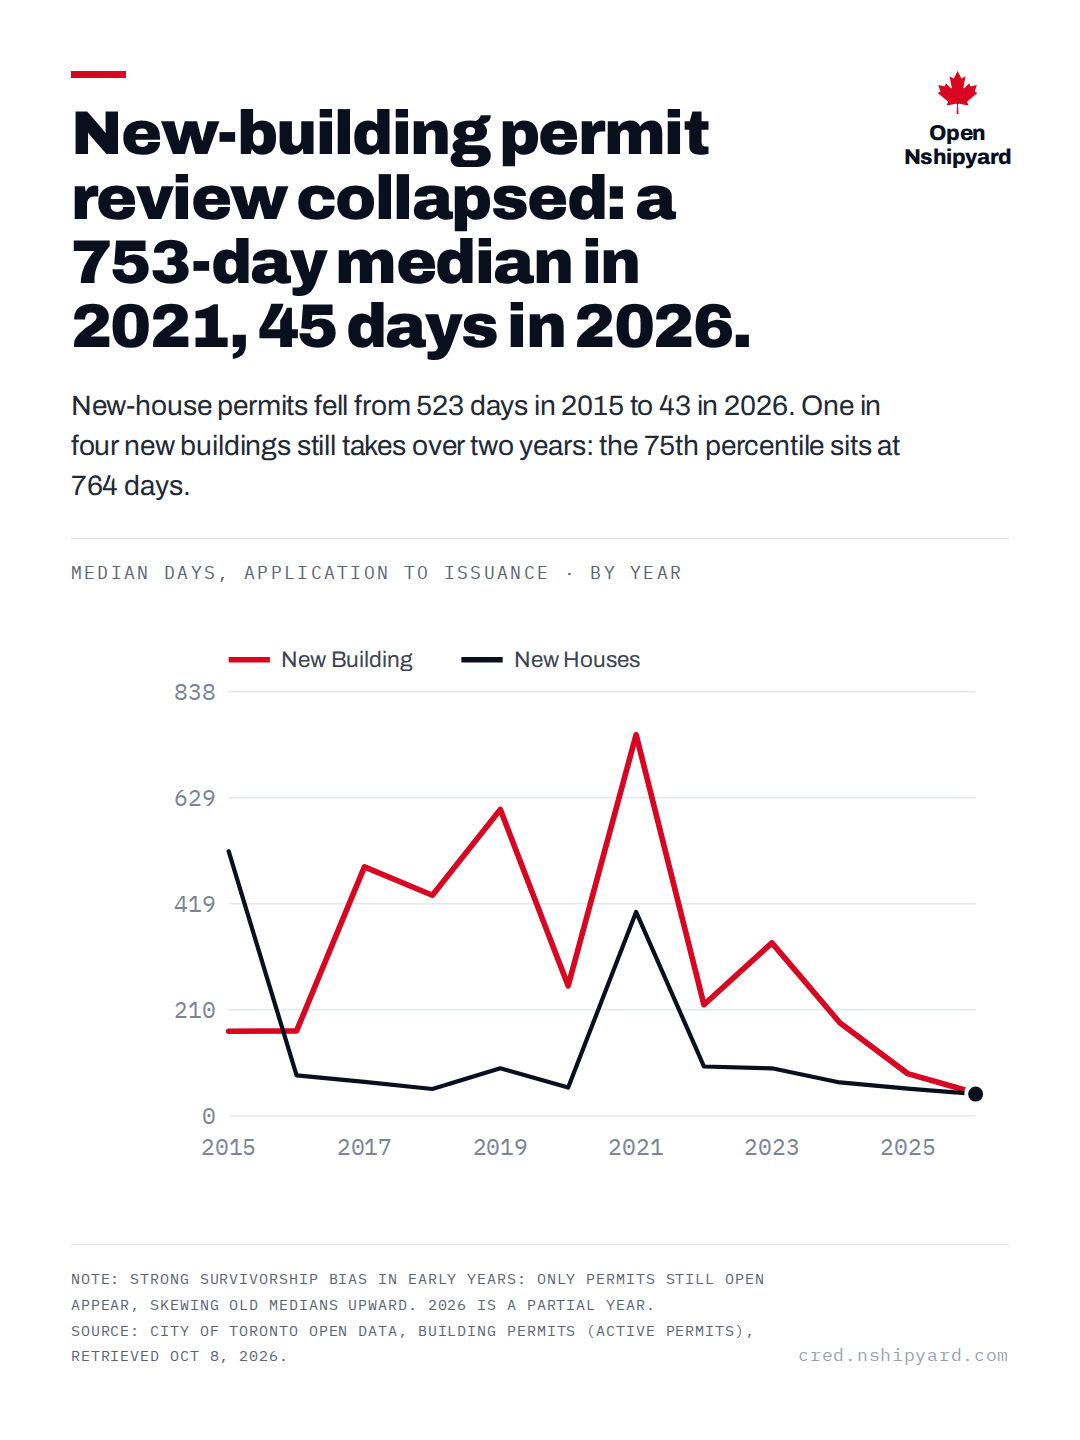
New-building permit review collapsed: a 753-day median in 2021, 45 days in 2026.
Open Nshipyard
New-house permits fell from 523 days in 2015 to 43 in 2026. One in four new buildings still takes over two years: the 75th percentile sits at 764 days.
Median days, application to issuance · by year
Note: Strong survivorship bias in early years: only permits still open appear, skewing old medians upward. 2026 is a partial year. Source: City of Toronto open data, Building Permits (Active Permits), retrieved Oct 8, 2026.
development.canada.nshipyard.com
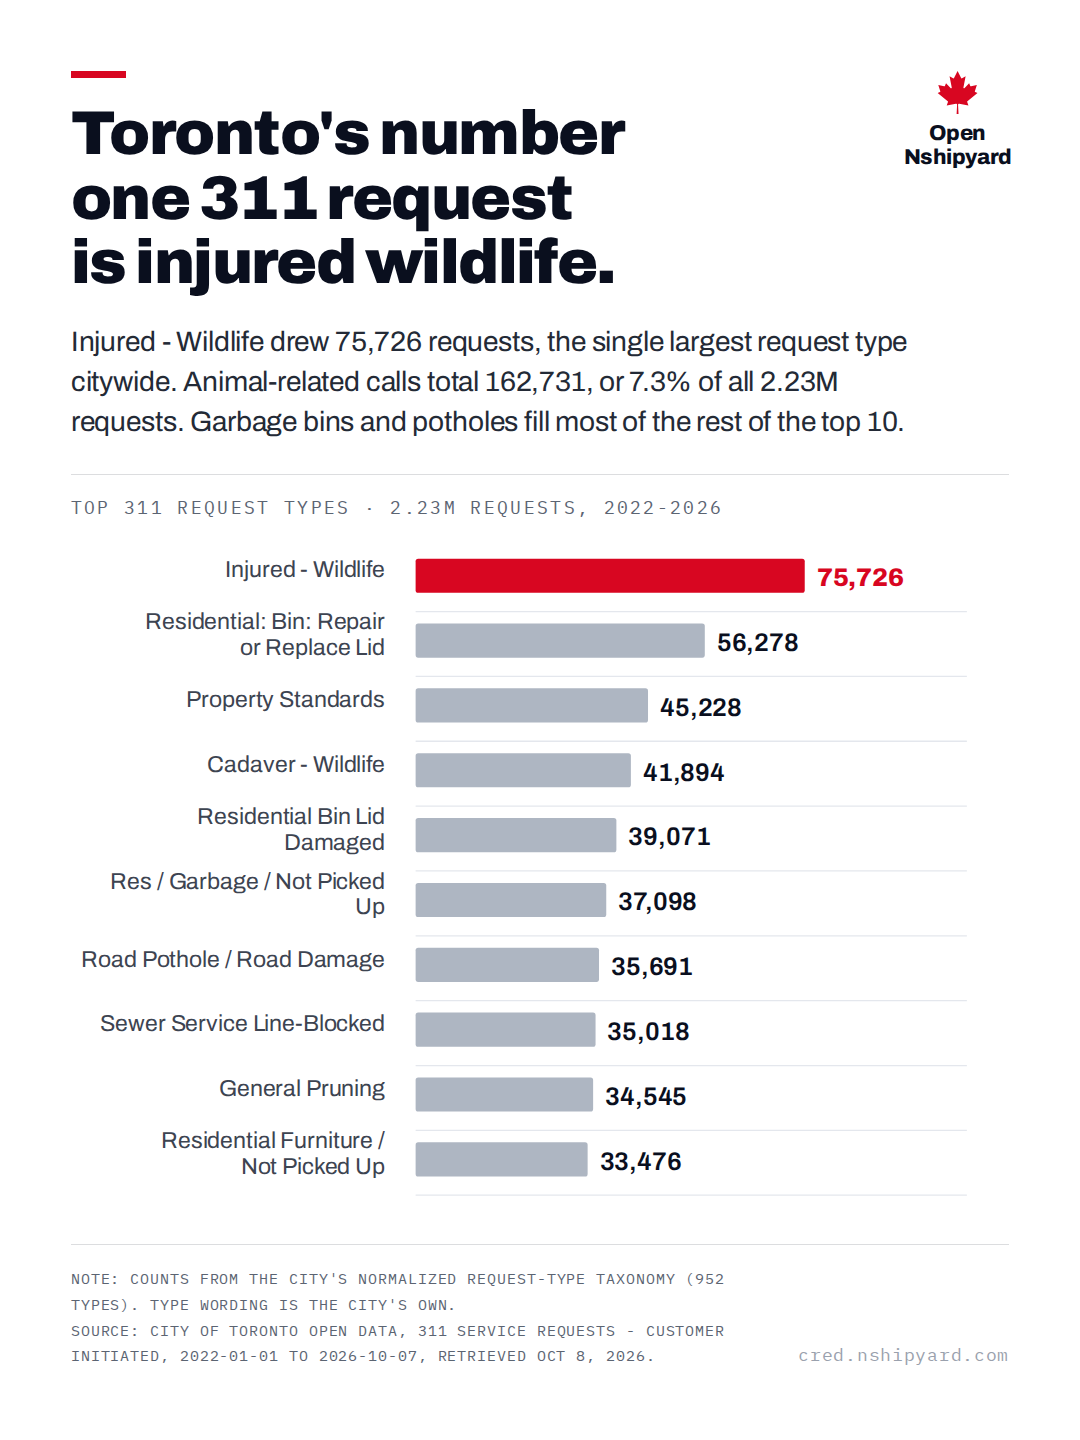
Toronto's number one 311 request is injured wildlife.
Open Nshipyard
Injured - Wildlife drew 75,726 requests, the single largest request type citywide. Animal-related calls total 162,731, or 7.3% of all 2.23M requests. Garbage bins and potholes fill most of the rest of the top 10.
Top 311 request types · 2.23M requests, 2022-2026
Note: Counts from the City's normalized request-type taxonomy (952 types). Type wording is the City's own. Source: City of Toronto open data, 311 Service Requests - Customer Initiated, 2022-01-01 to 2026-10-07, retrieved Oct 8, 2026.
311.canada.nshipyard.com
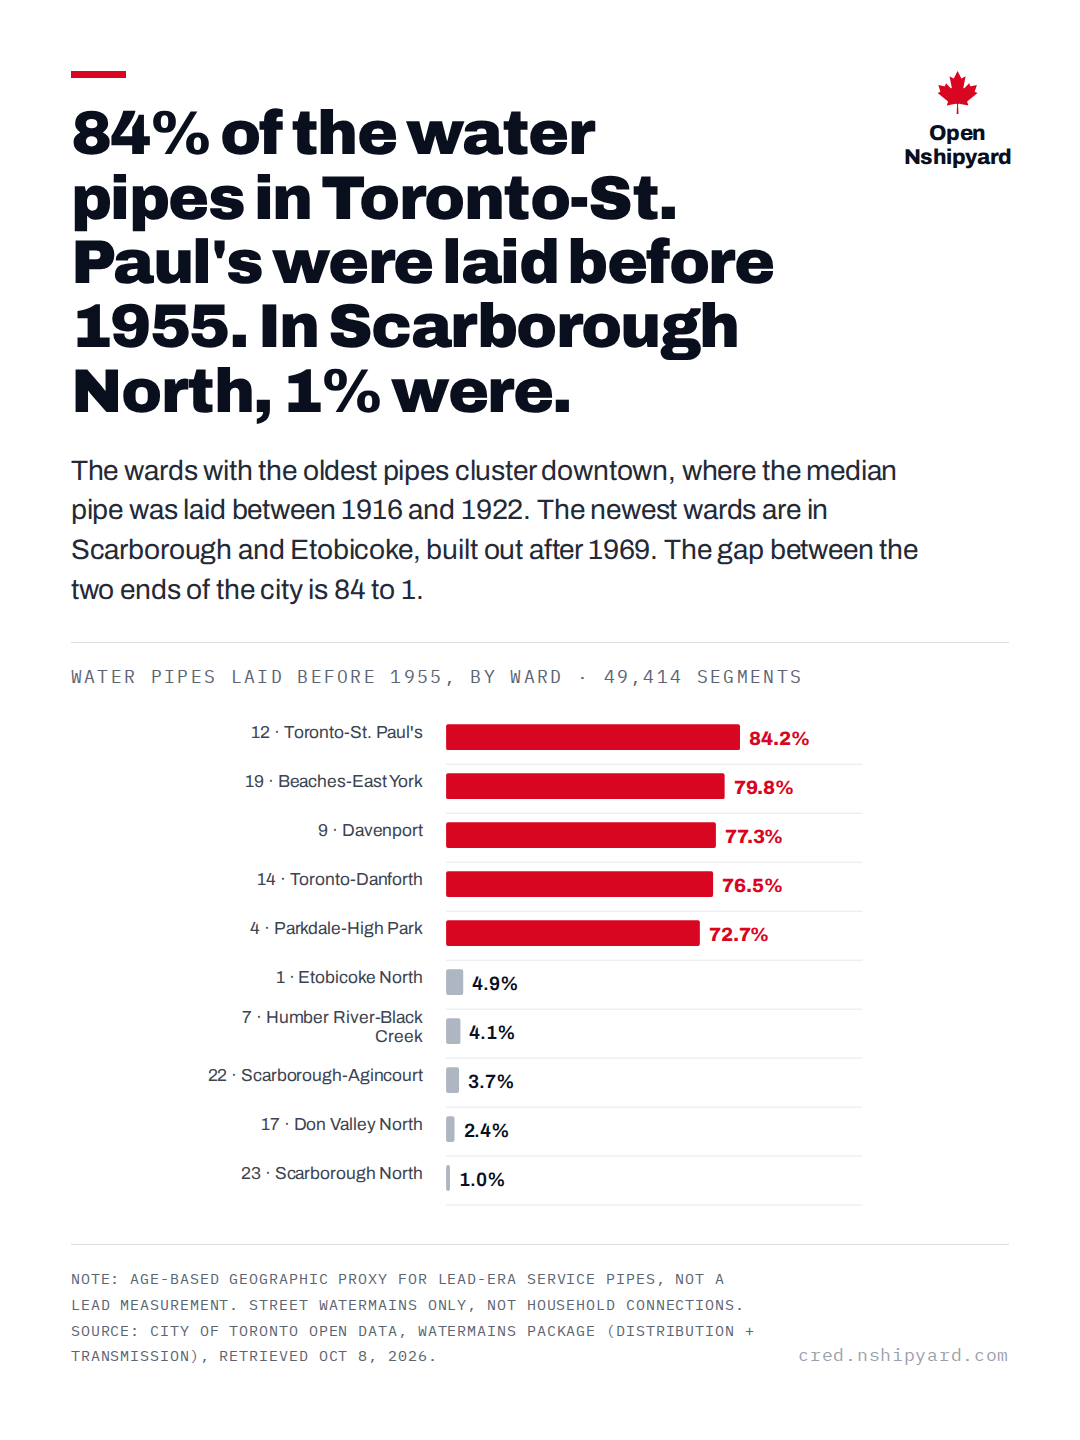
84% of the water pipes in Toronto-St. Paul's were laid before 1955. In Scarborough North, 1% were.
Open Nshipyard
The wards with the oldest pipes cluster downtown, where the median pipe was laid between 1916 and 1922. The newest wards are in Scarborough and Etobicoke, built out after 1969. The gap between the two ends of the city is 84 to 1.
Water pipes laid before 1955, by ward · 49,414 segments
Note: Age-based geographic proxy for lead-era service pipes, not a lead measurement. Street watermains only, not household connections. Source: City of Toronto open data, Watermains package (distribution + transmission), retrieved Oct 8, 2026.
watermains.canada.nshipyard.com
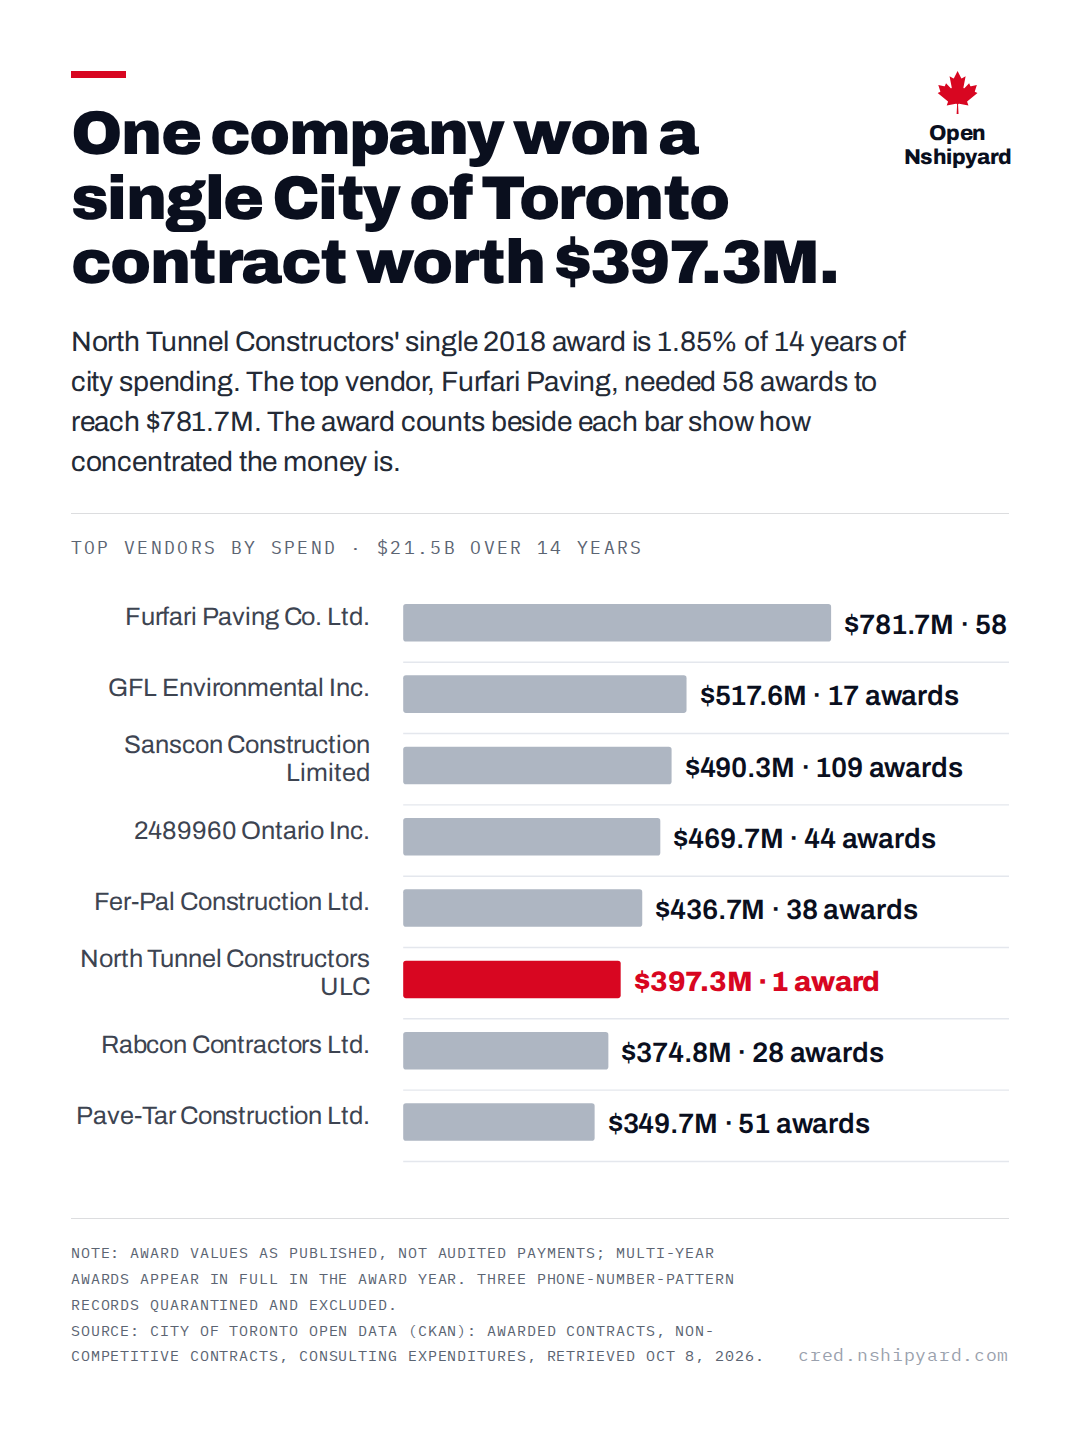
One company won a single City of Toronto contract worth $397.3M.
Open Nshipyard
North Tunnel Constructors' single 2018 award is 1.85% of 14 years of city spending. The top vendor, Furfari Paving, needed 58 awards to reach $781.7M. The award counts beside each bar show how concentrated the money is.
Top vendors by spend · $21.5B over 14 years
Note: Award values as published, not audited payments; multi-year awards appear in full in the award year. Three phone-number-pattern records quarantined and excluded. Source: City of Toronto open data (CKAN): awarded contracts, non-competitive contracts, consulting expenditures, retrieved Oct 8, 2026.
procurement.canada.nshipyard.com
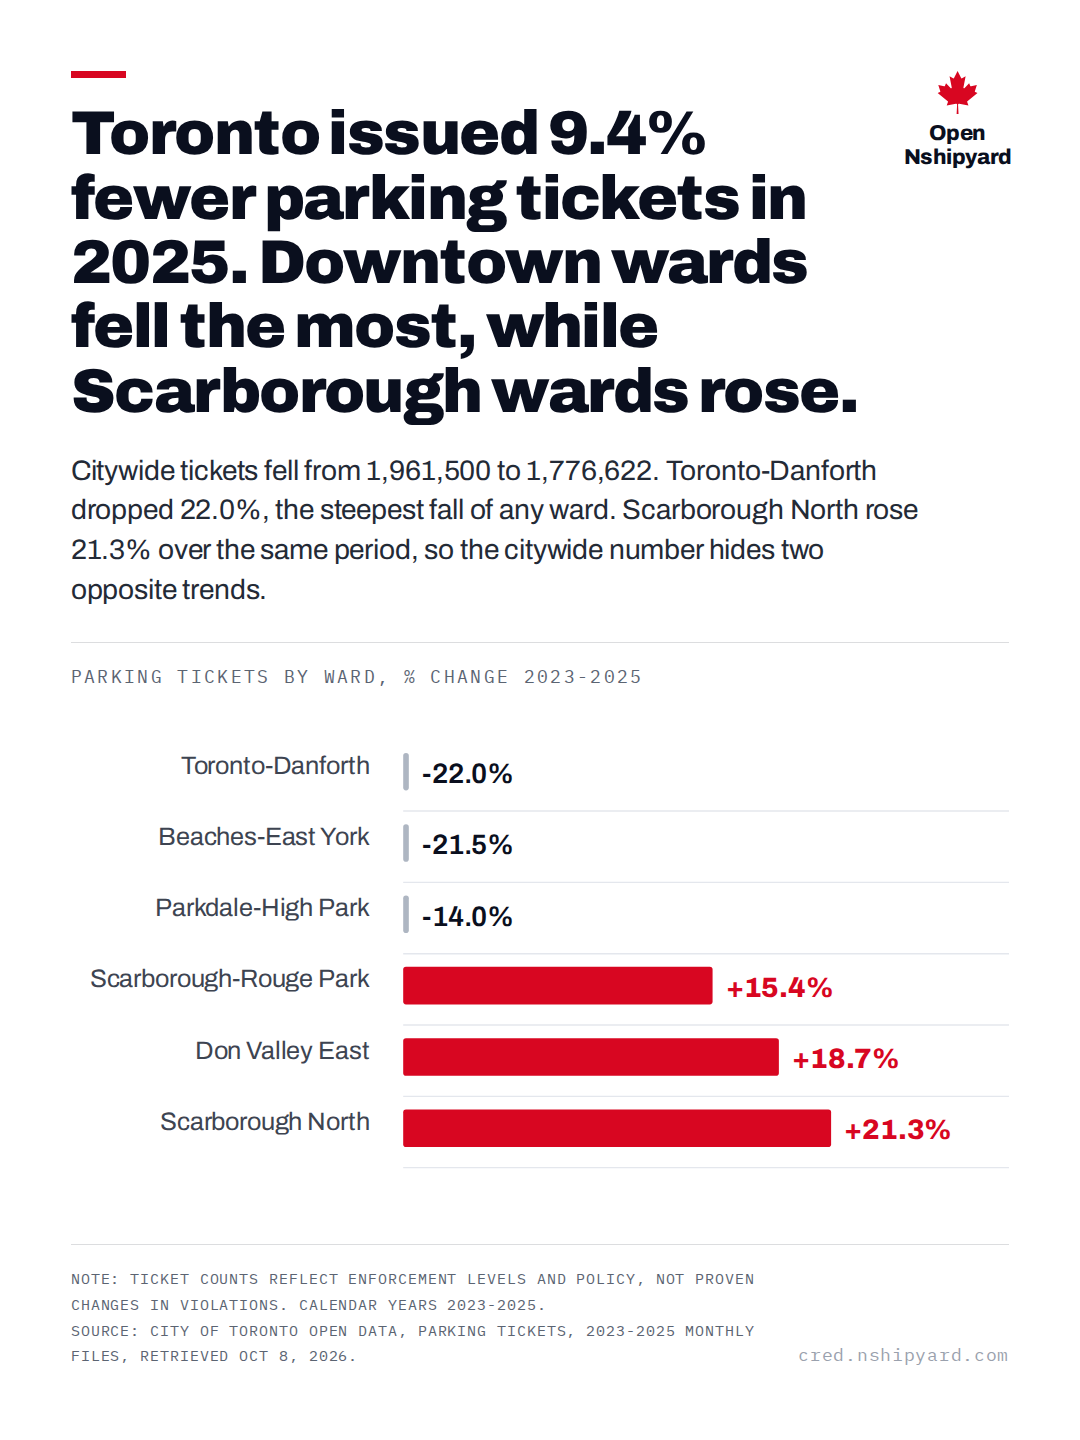
Toronto issued 9.4% fewer parking tickets in 2025. Downtown wards fell the most, while Scarborough wards rose.
Open Nshipyard
Citywide tickets fell from 1,961,500 to 1,776,622. Toronto-Danforth dropped 22.0%, the steepest fall of any ward. Scarborough North rose 21.3% over the same period, so the citywide number hides two opposite trends.
Parking tickets by ward, % change 2023-2025
Note: Ticket counts reflect enforcement levels and policy, not proven changes in violations. Calendar years 2023-2025. Source: City of Toronto open data, Parking Tickets, 2023-2025 monthly files, retrieved Oct 8, 2026.
parking.canada.nshipyard.com
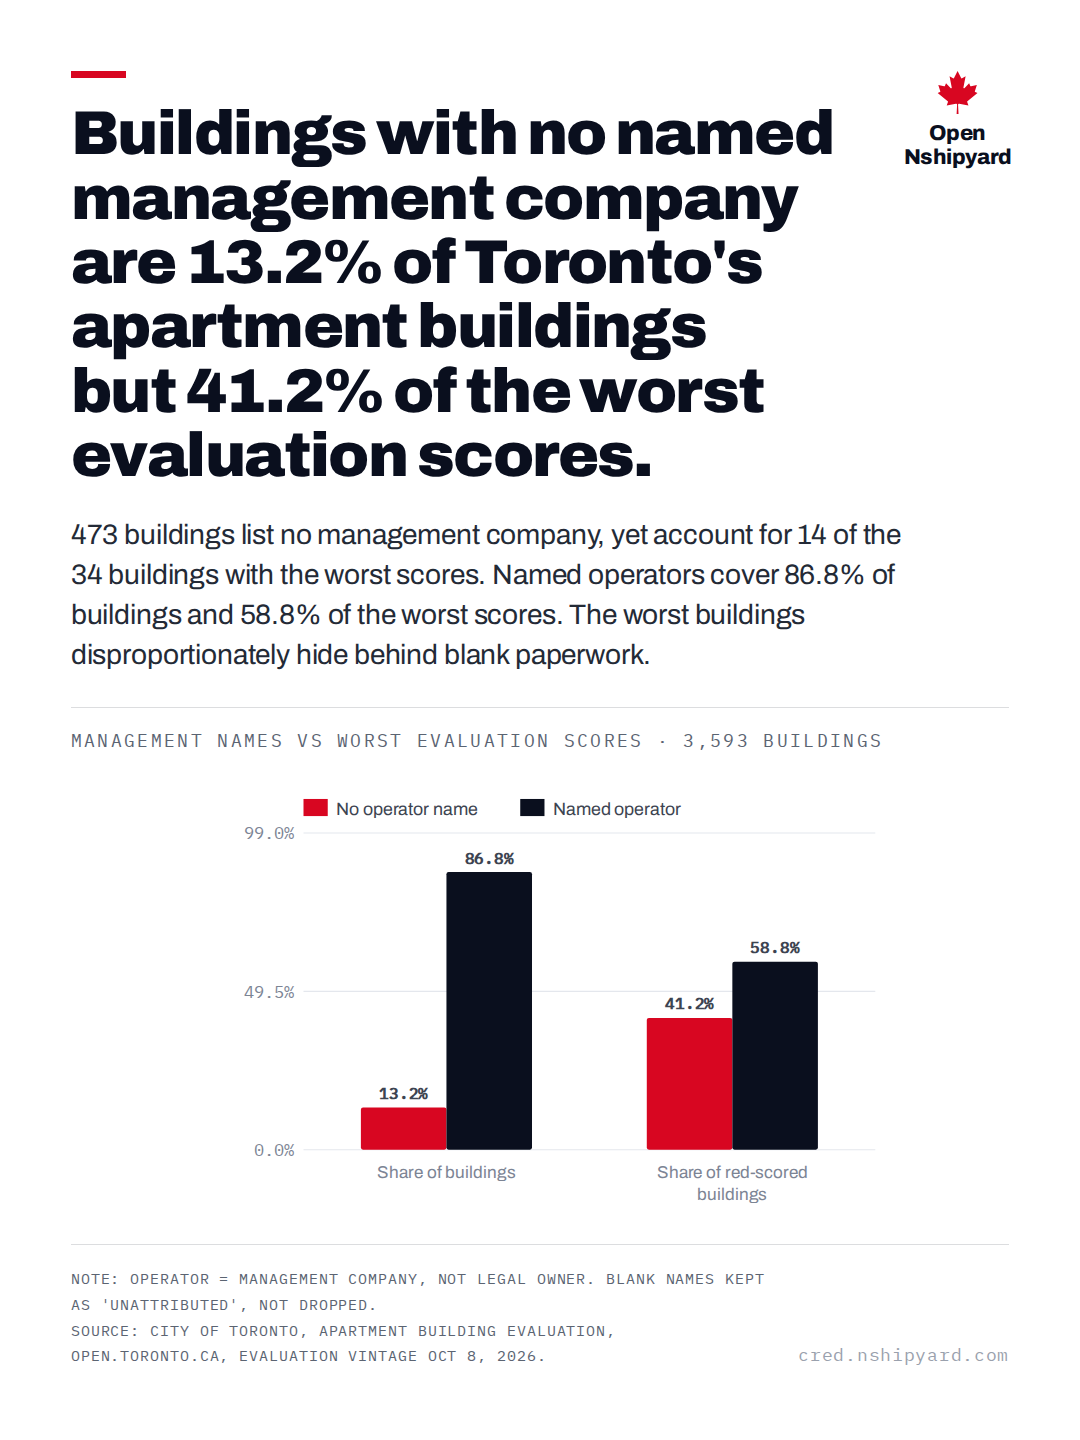
Buildings with no named management company are 13.2% of Toronto's apartment buildings but 41.2% of the worst evaluation scores.
Open Nshipyard
473 buildings list no management company, yet account for 14 of the 34 buildings with the worst scores. Named operators cover 86.8% of buildings and 58.8% of the worst scores. The worst buildings disproportionately hide behind blank paperwork.
Management names vs worst evaluation scores · 3,593 buildings
Note: Operator = management company, not legal owner. Blank names kept as 'unattributed', not dropped. Source: City of Toronto, Apartment Building Evaluation, open.toronto.ca, evaluation vintage Oct 8, 2026.
canada-landlord-index.vercel.app
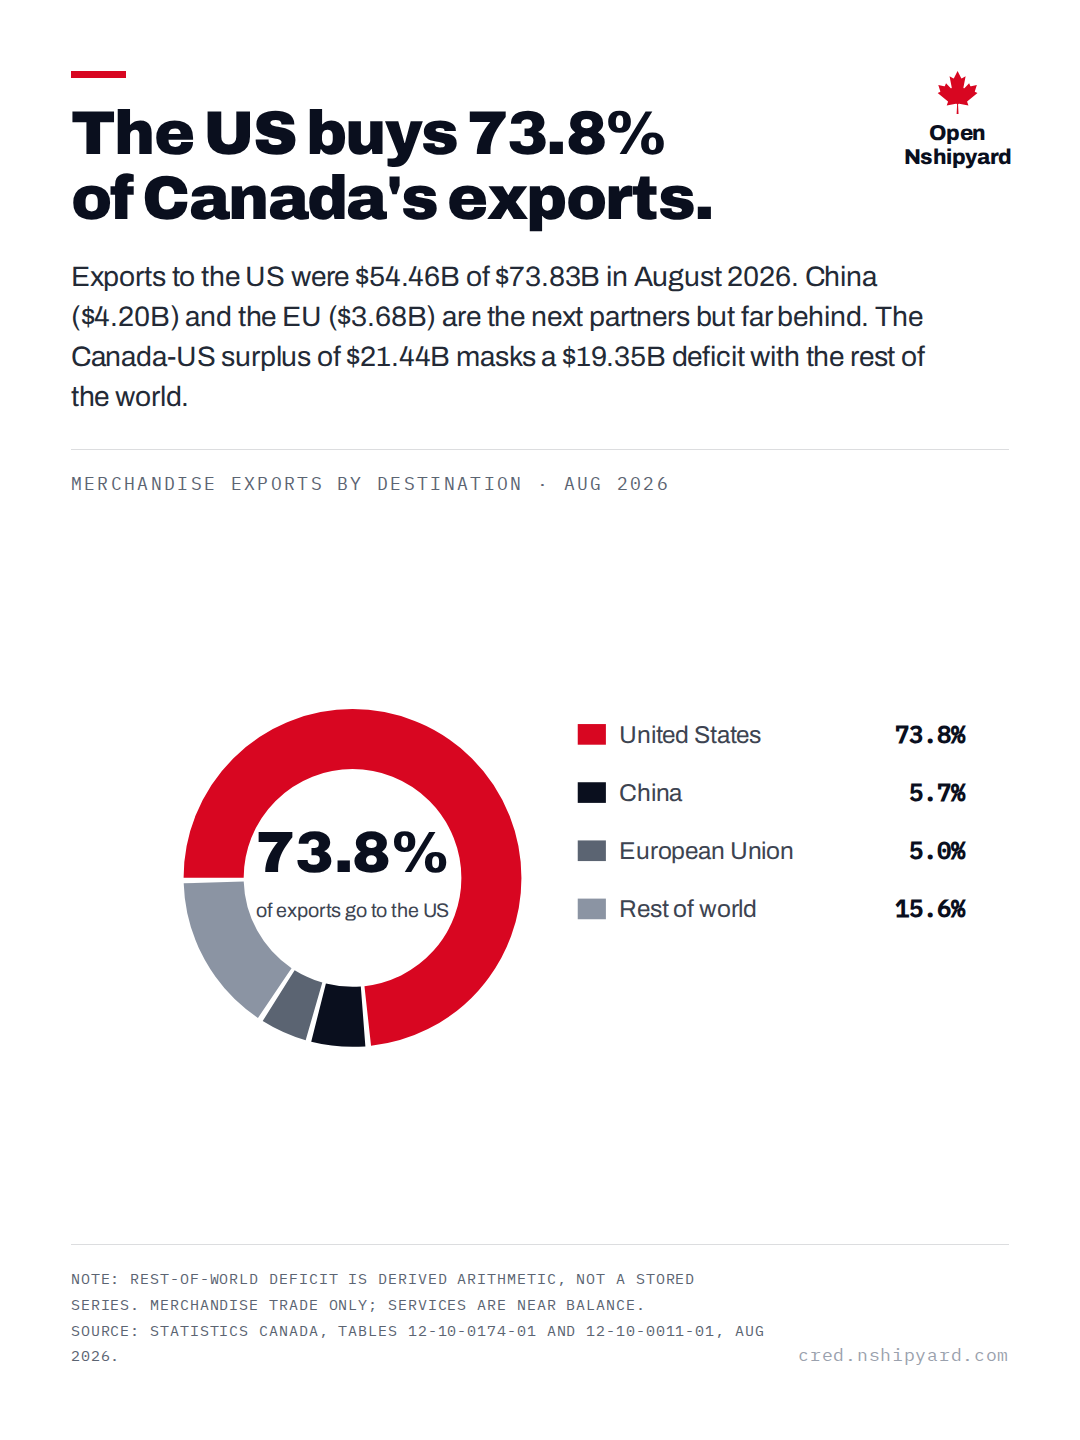
The US buys 73.8% of Canada's exports.
Open Nshipyard
Exports to the US were $54.46B of $73.83B in August 2026. China ($4.20B) and the EU ($3.68B) are the next partners but far behind. The Canada-US surplus of $21.44B masks a $19.35B deficit with the rest of the world.
Merchandise exports by destination · Aug 2026
Note: Rest-of-world deficit is derived arithmetic, not a stored series. Merchandise trade only; services are near balance. Source: Statistics Canada, tables 12-10-0174-01 and 12-10-0011-01, Aug 2026.
canada.nshipyard.com
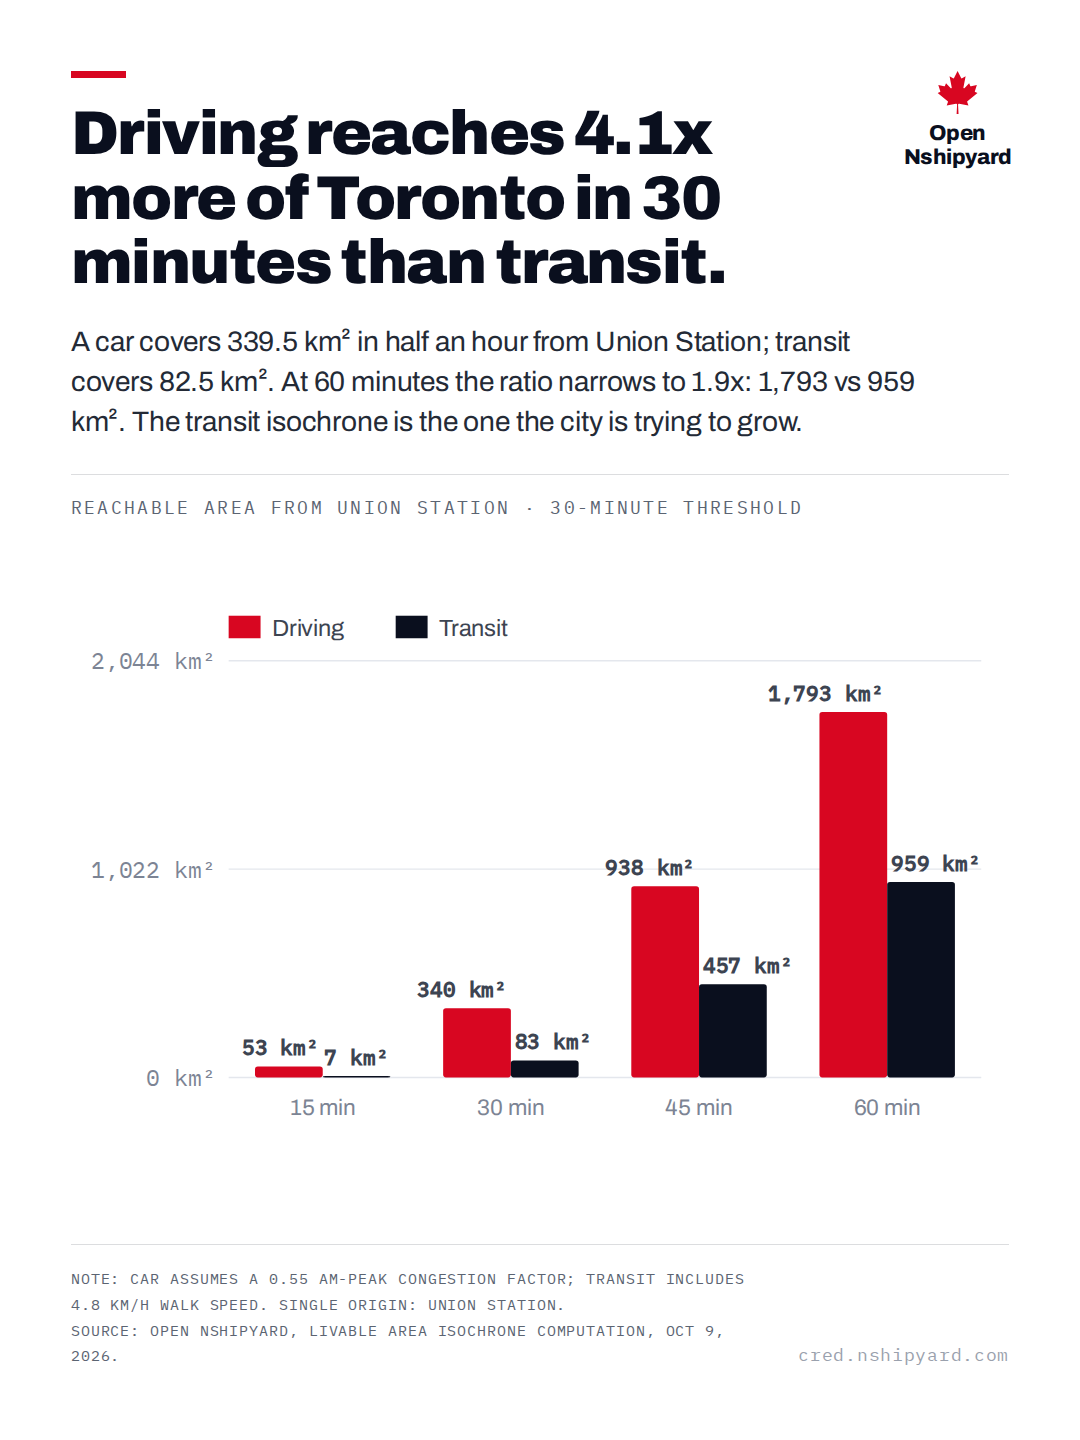
Driving reaches 4.1x more of Toronto in 30 minutes than transit.
Open Nshipyard
A car covers 339.5 km² in half an hour from Union Station; transit covers 82.5 km². At 60 minutes the ratio narrows to 1.9x: 1,793 vs 959 km². The transit isochrone is the one the city is trying to grow.
Reachable area from Union Station · 30-minute threshold
Note: Car assumes a 0.55 AM-peak congestion factor; transit includes 4.8 km/h walk speed. Single origin: Union Station. Source: Open Nshipyard, Livable Area isochrone computation, Oct 9, 2026.
livable.canada.nshipyard.com
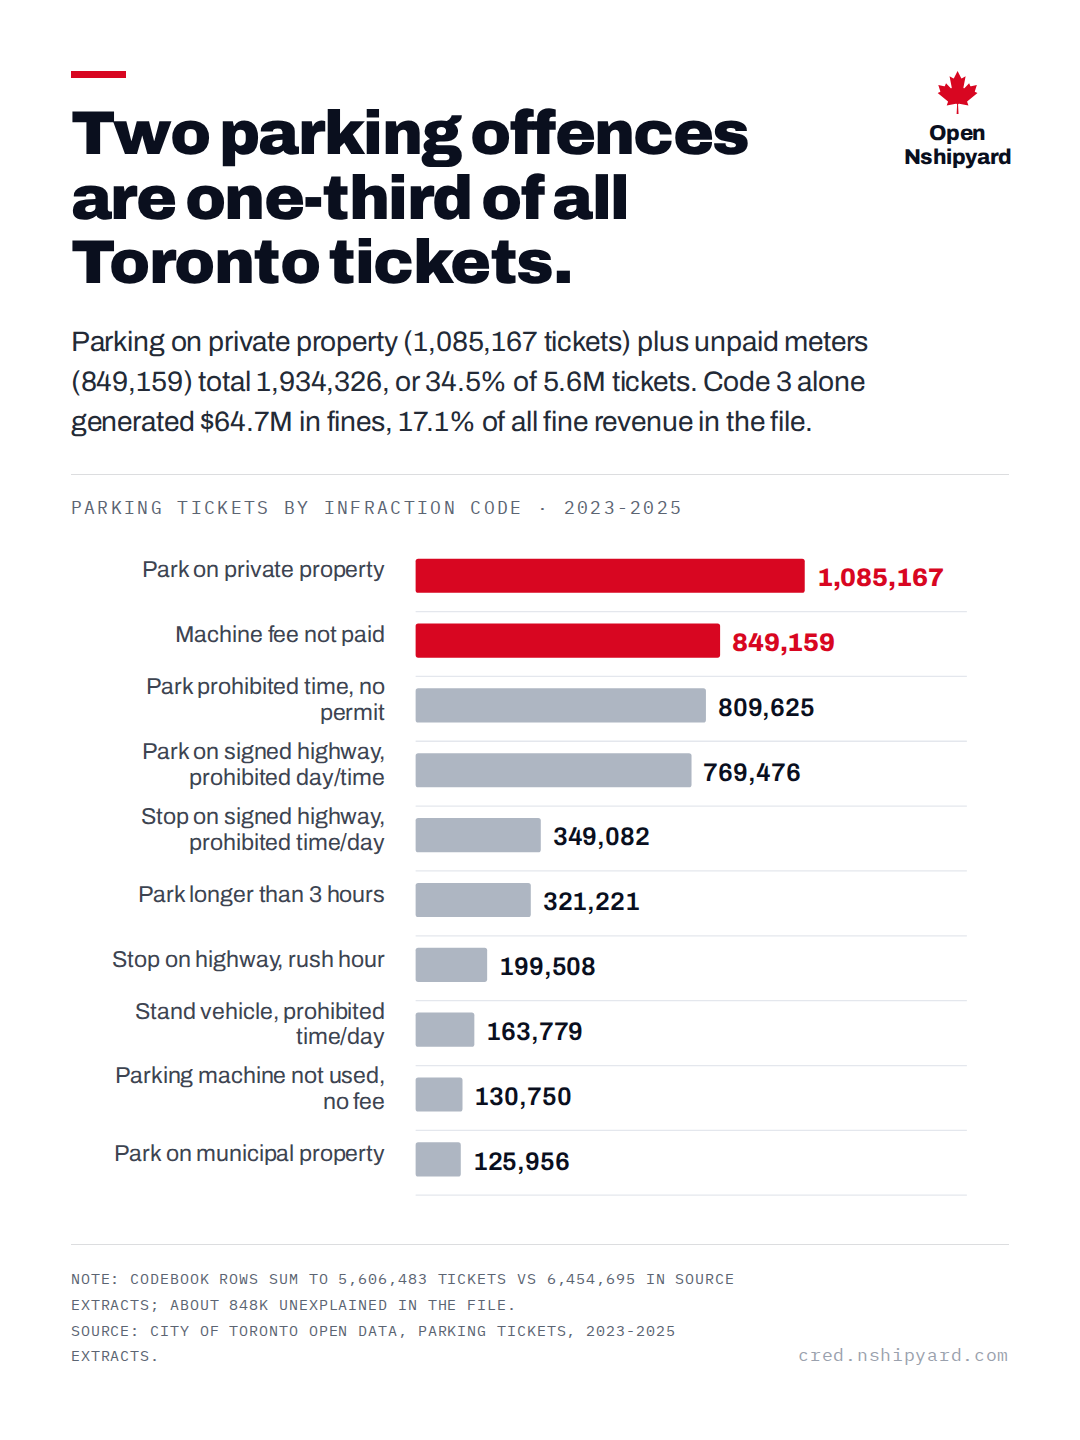
Two parking offences are one-third of all Toronto tickets.
Open Nshipyard
Parking on private property (1,085,167 tickets) plus unpaid meters (849,159) total 1,934,326, or 34.5% of 5.6M tickets. Code 3 alone generated $64.7M in fines, 17.1% of all fine revenue in the file.
Parking tickets by infraction code · 2023-2025
Note: Codebook rows sum to 5,606,483 tickets vs 6,454,695 in source extracts; about 848k unexplained in the file. Source: City of Toronto open data, Parking Tickets, 2023-2025 extracts.
codebooks.canada.nshipyard.com
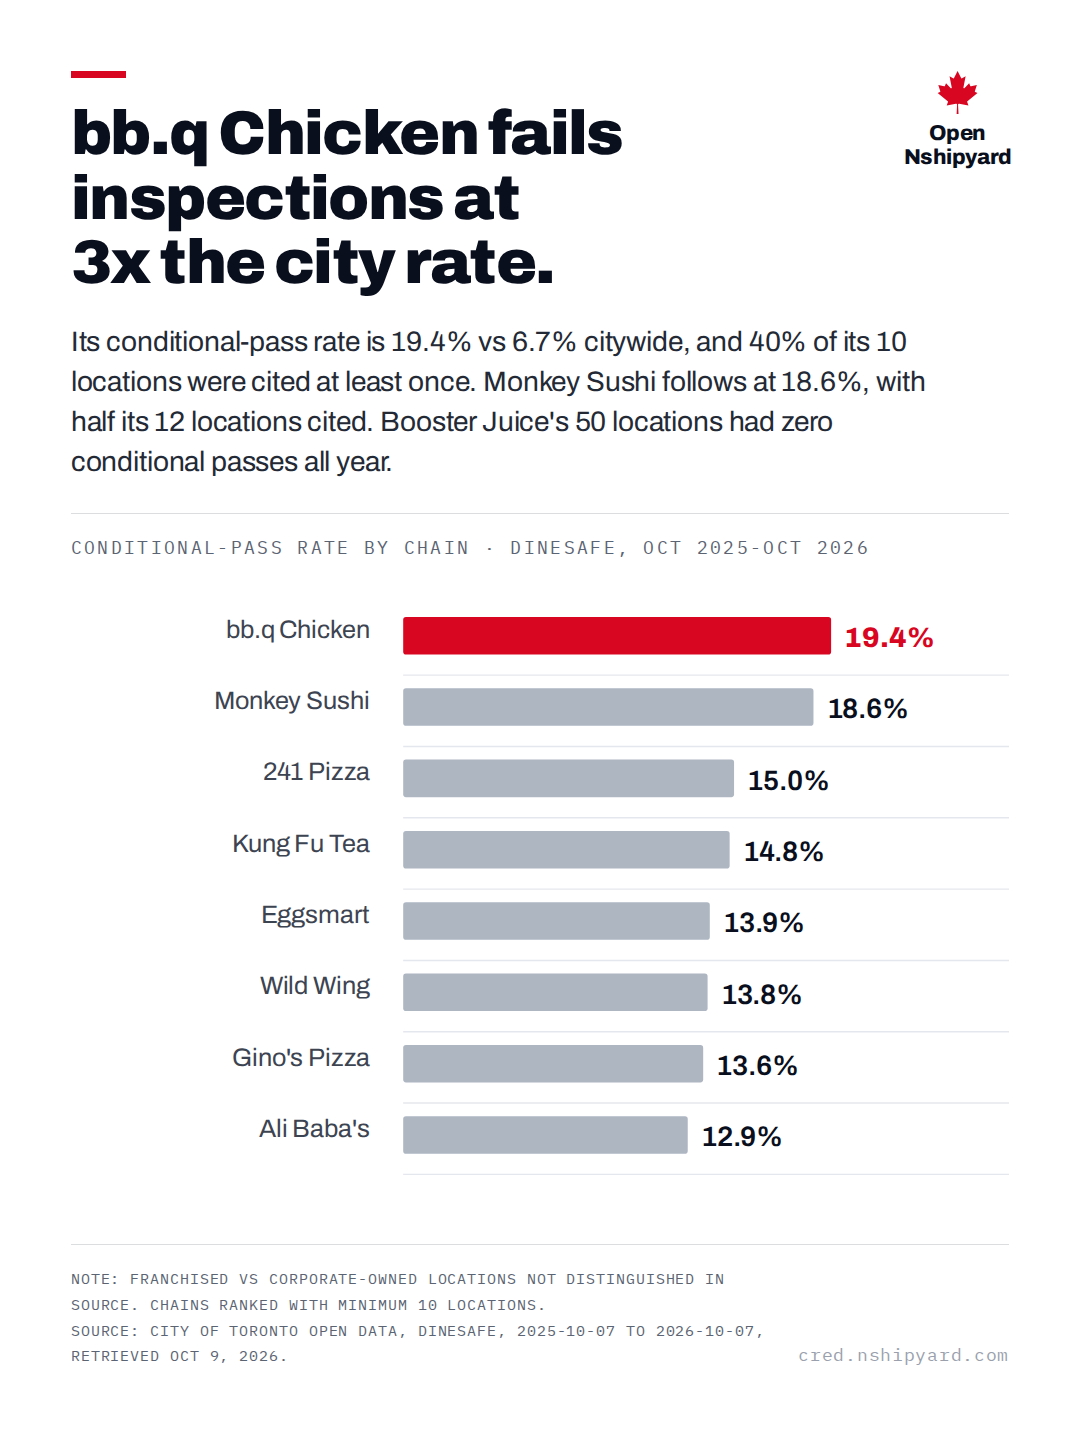
bb.q Chicken fails inspections at 3x the city rate.
Open Nshipyard
Its conditional-pass rate is 19.4% vs 6.7% citywide, and 40% of its 10 locations were cited at least once. Monkey Sushi follows at 18.6%, with half its 12 locations cited. Booster Juice's 50 locations had zero conditional passes all year.
Conditional-pass rate by chain · DineSafe, Oct 2025-Oct 2026
Note: Franchised vs corporate-owned locations not distinguished in source. Chains ranked with minimum 10 locations. Source: City of Toronto open data, DineSafe, 2025-10-07 to 2026-10-07, retrieved Oct 9, 2026.
canada.nshipyard.com
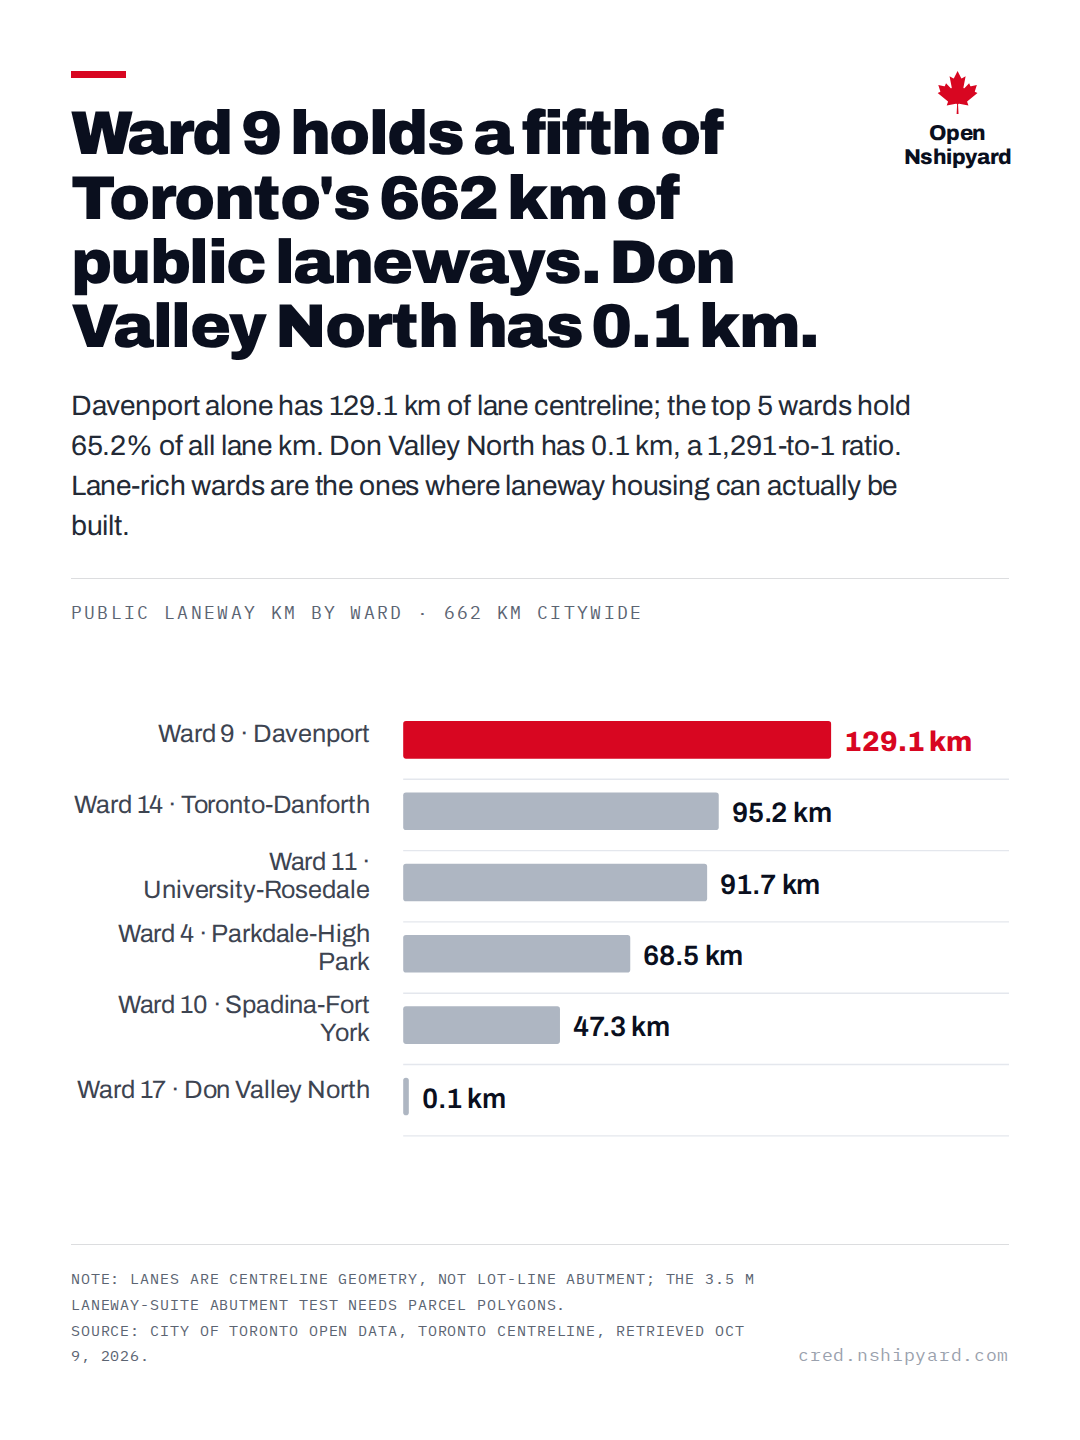
Ward 9 holds a fifth of Toronto's 662 km of public laneways. Don Valley North has 0.1 km.
Open Nshipyard
Davenport alone has 129.1 km of lane centreline; the top 5 wards hold 65.2% of all lane km. Don Valley North has 0.1 km, a 1,291-to-1 ratio. Lane-rich wards are the ones where laneway housing can actually be built.
Public laneway km by ward · 662 km citywide
Note: Lanes are centreline geometry, not lot-line abutment; the 3.5 m laneway-suite abutment test needs parcel polygons. Source: City of Toronto open data, Toronto Centreline, retrieved Oct 9, 2026.
buildcheck.nshipyard.com
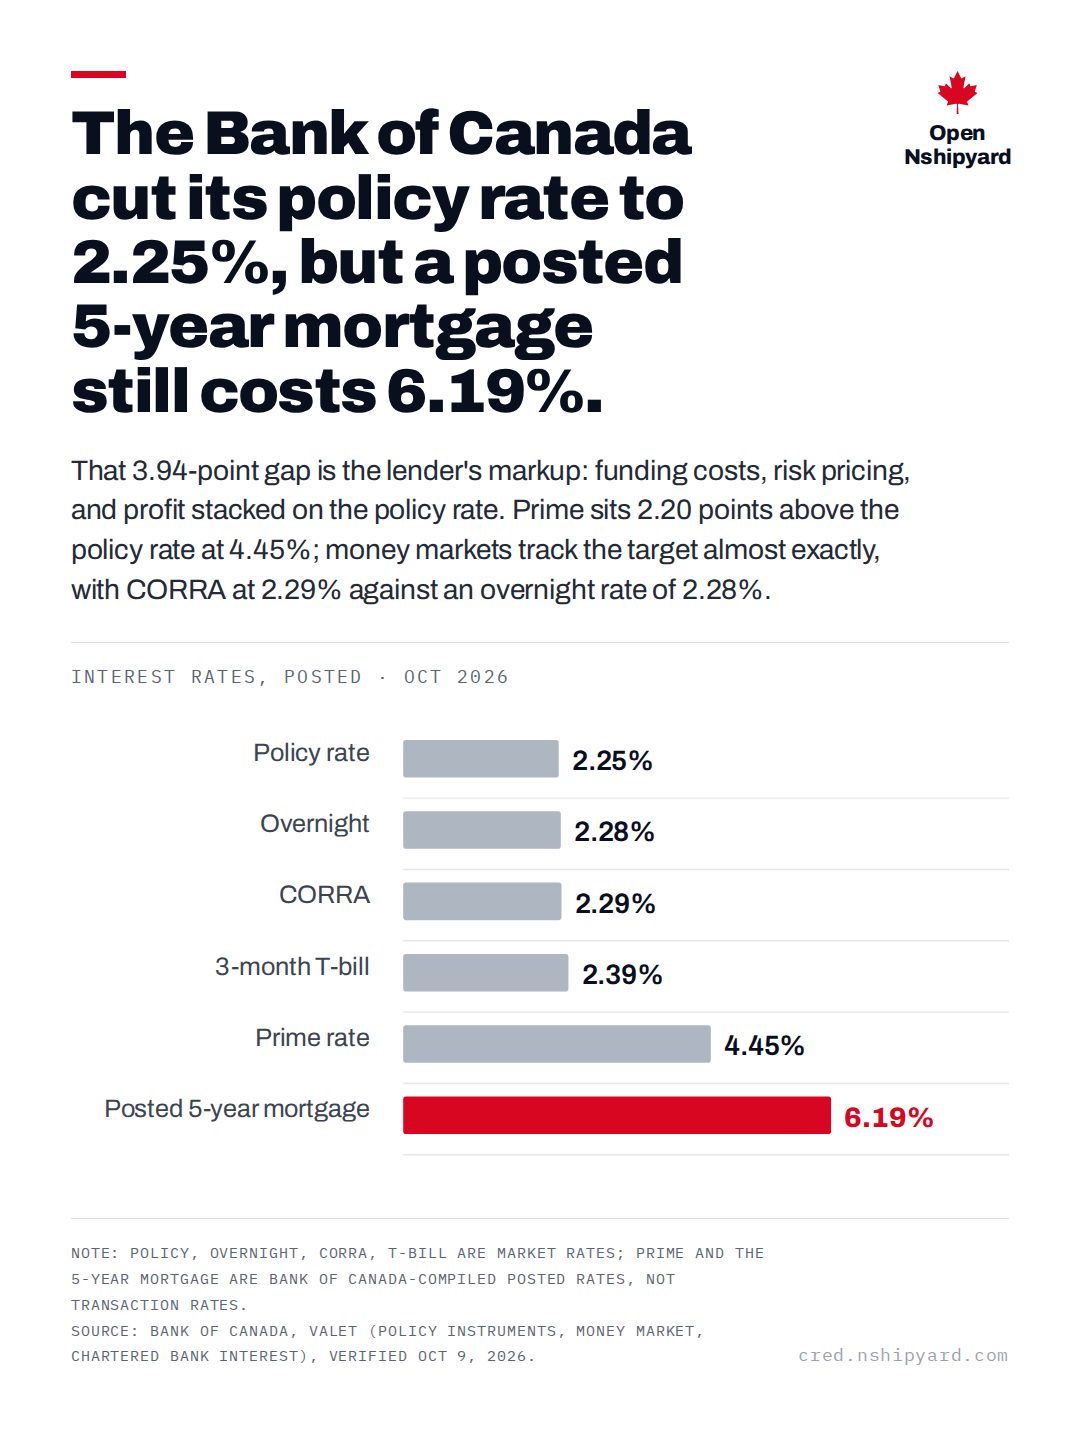
The Bank of Canada cut its policy rate to 2.25%, but a posted 5-year mortgage still costs 6.19%.
Open Nshipyard
That 3.94-point gap is the lender's markup: funding costs, risk pricing, and profit stacked on the policy rate. Prime sits 2.20 points above the policy rate at 4.45%; money markets track the target almost exactly, with CORRA at 2.29% against an overnight rate of 2.28%.
Interest rates, posted · Oct 2026
Note: Policy, overnight, CORRA, T-bill are market rates; prime and the 5-year mortgage are Bank of Canada-compiled posted rates, not transaction rates. Source: Bank of Canada, Valet (policy instruments, money market, chartered bank interest), verified Oct 9, 2026.
canada.nshipyard.com
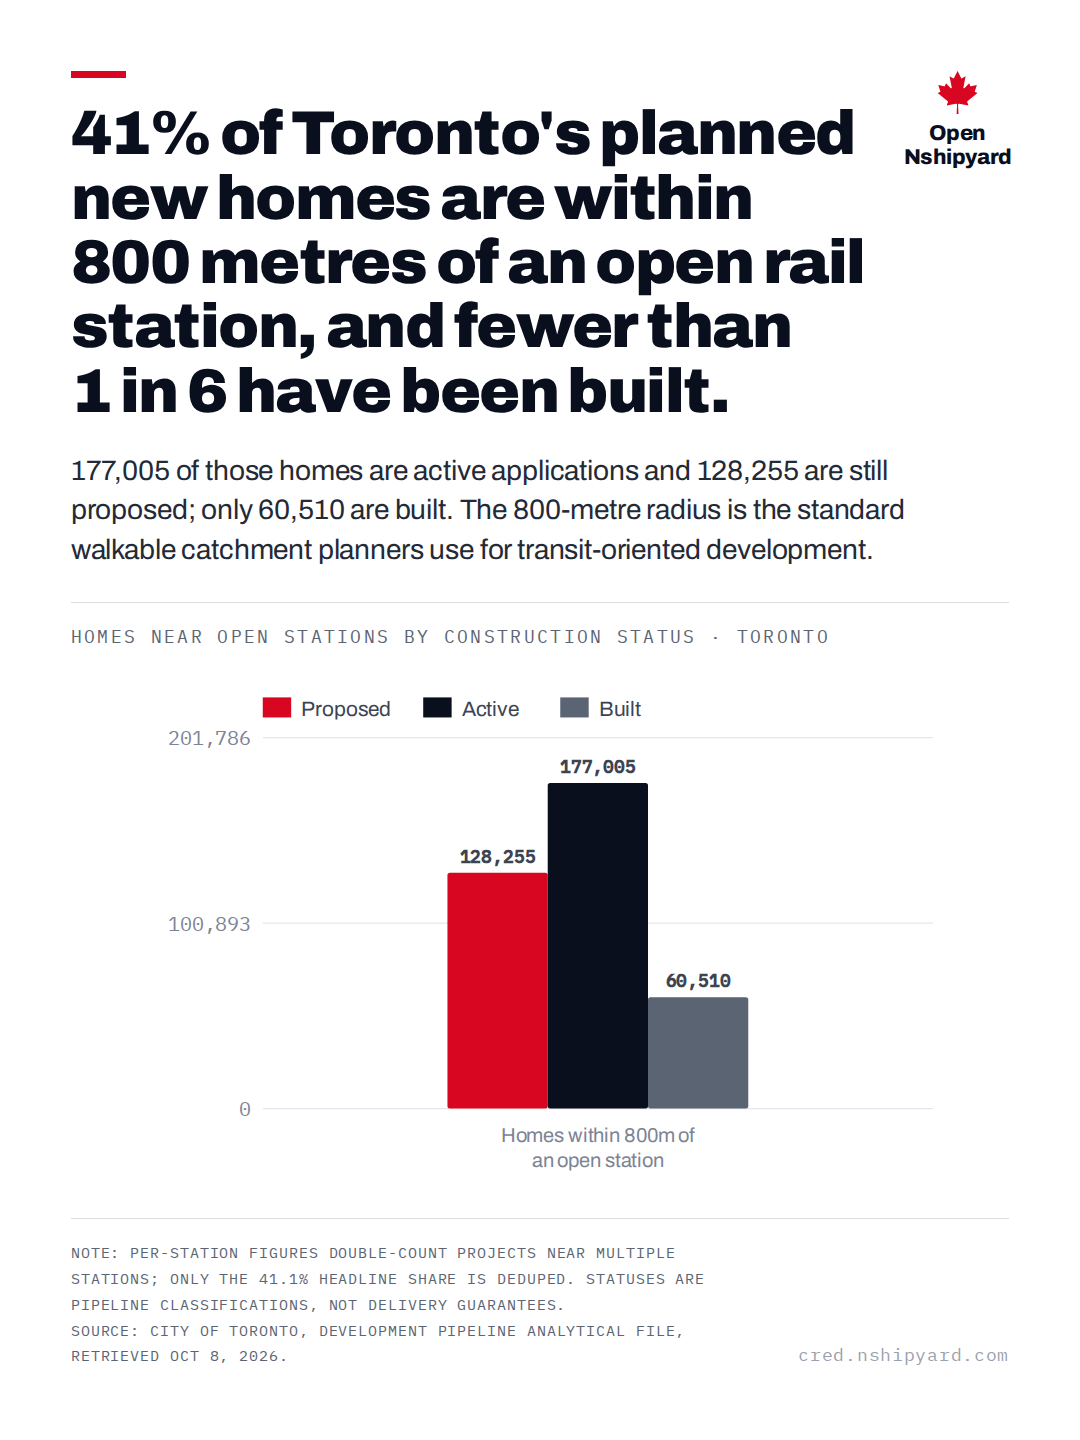
41% of Toronto's planned new homes are within 800 metres of an open rail station, and fewer than 1 in 6 have been built.
Open Nshipyard
177,005 of those homes are active applications and 128,255 are still proposed; only 60,510 are built. The 800-metre radius is the standard walkable catchment planners use for transit-oriented development.
Homes near open stations by construction status · Toronto
Note: Per-station figures double-count projects near multiple stations; only the 41.1% headline share is deduped. Statuses are pipeline classifications, not delivery guarantees. Source: City of Toronto, Development Pipeline analytical file, retrieved Oct 8, 2026.
supply.canada.nshipyard.com
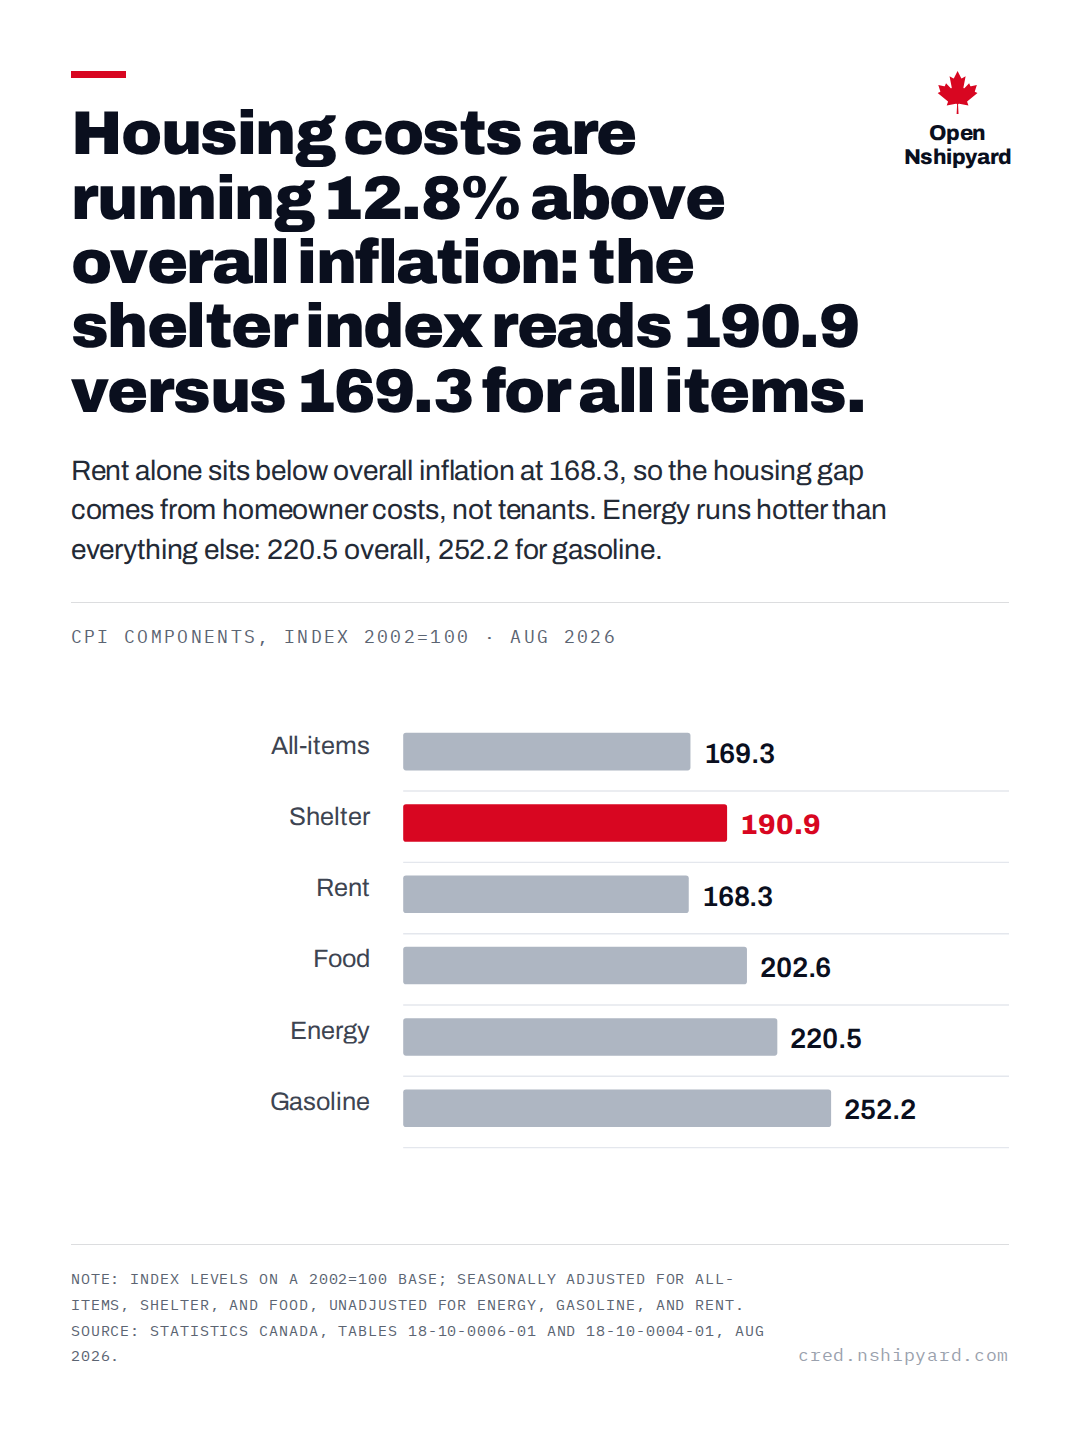
Housing costs are running 12.8% above overall inflation: the shelter index reads 190.9 versus 169.3 for all items.
Open Nshipyard
Rent alone sits below overall inflation at 168.3, so the housing gap comes from homeowner costs, not tenants. Energy runs hotter than everything else: 220.5 overall, 252.2 for gasoline.
CPI components, index 2002=100 · Aug 2026
Note: Index levels on a 2002=100 base; seasonally adjusted for all-items, shelter, and food, unadjusted for energy, gasoline, and rent. Source: Statistics Canada, tables 18-10-0006-01 and 18-10-0004-01, Aug 2026.
canada.nshipyard.com
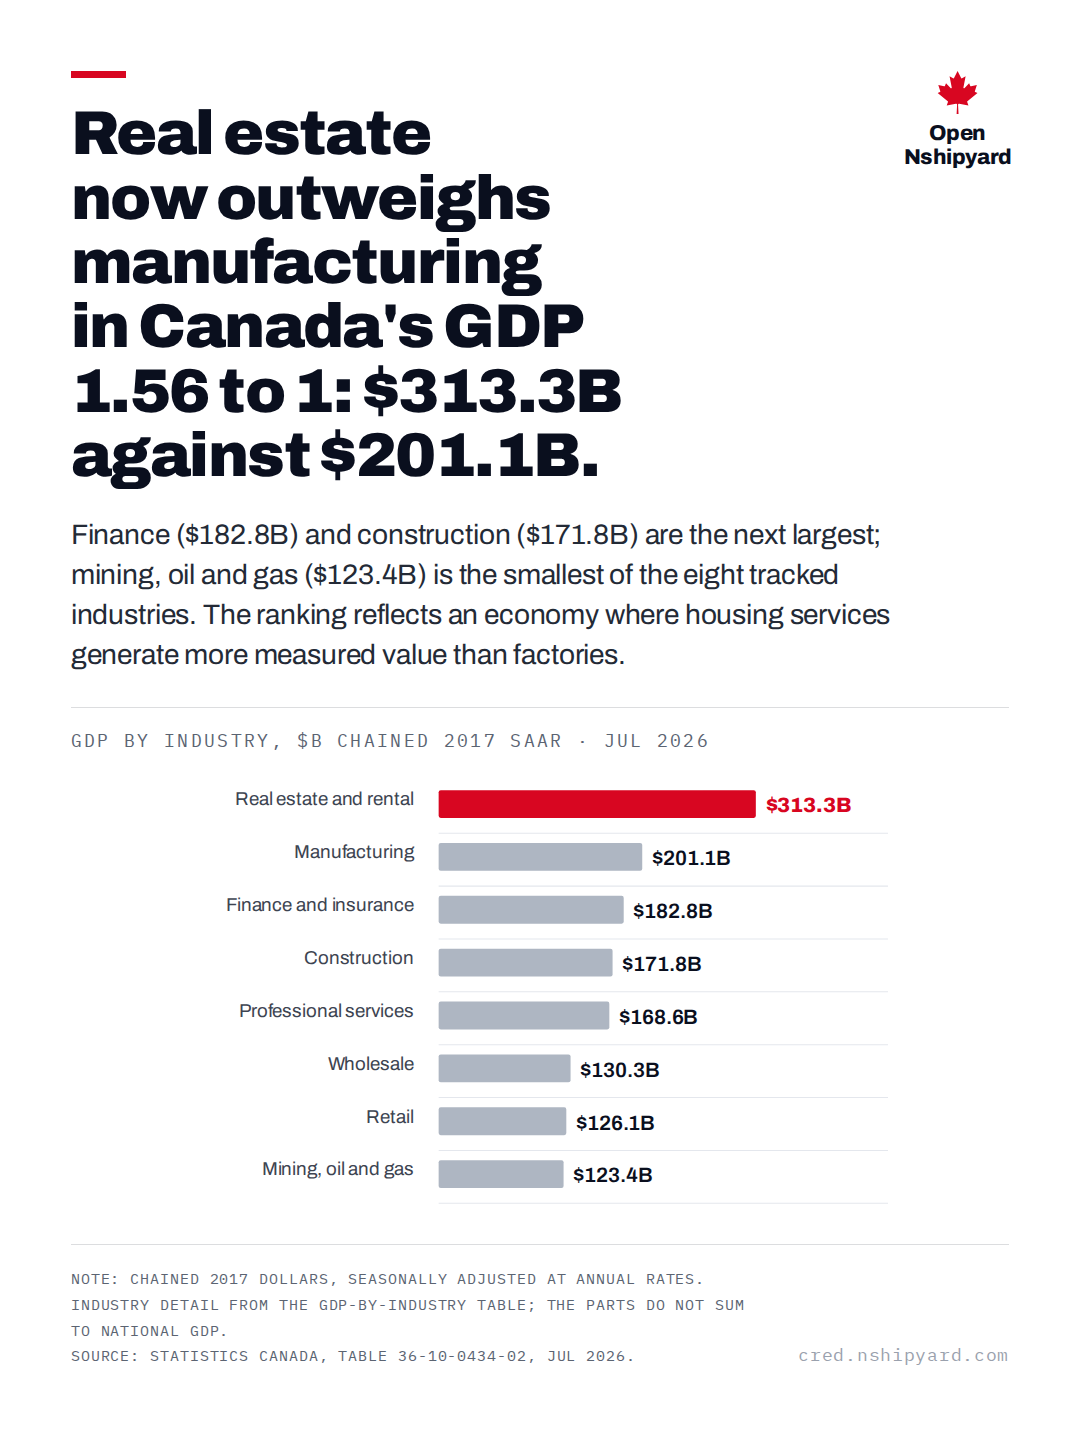
Real estate now outweighs manufacturing in Canada's GDP 1.56 to 1: $313.3B against $201.1B.
Open Nshipyard
Finance ($182.8B) and construction ($171.8B) are the next largest; mining, oil and gas ($123.4B) is the smallest of the eight tracked industries. The ranking reflects an economy where housing services generate more measured value than factories.
GDP by industry, $B chained 2017 SAAR · Jul 2026
Note: Chained 2017 dollars, seasonally adjusted at annual rates. Industry detail from the GDP-by-industry table; the parts do not sum to national GDP. Source: Statistics Canada, table 36-10-0434-02, Jul 2026.
canada.nshipyard.com
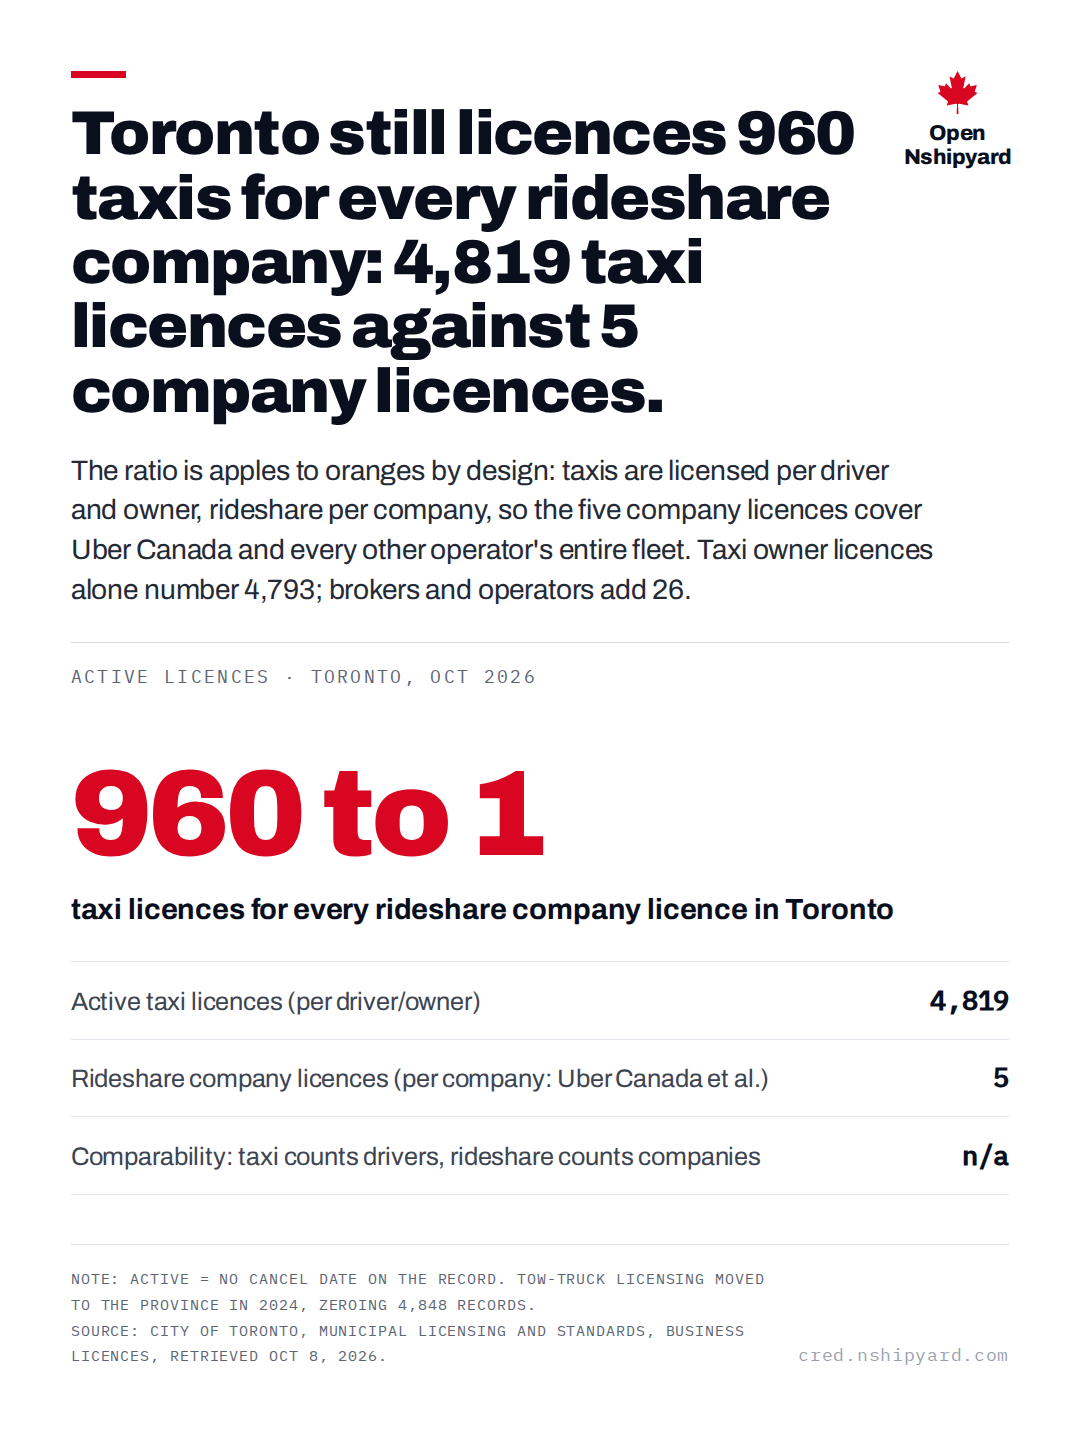
Toronto still licences 960 taxis for every rideshare company: 4,819 taxi licences against 5 company licences.
Open Nshipyard
The ratio is apples to oranges by design: taxis are licensed per driver and owner, rideshare per company, so the five company licences cover Uber Canada and every other operator's entire fleet. Taxi owner licences alone number 4,793; brokers and operators add 26.
Active licences · Toronto, Oct 2026
960 to 1
taxi licences for every rideshare company licence in Toronto
Active taxi licences (per driver/owner)4,819
Rideshare company licences (per company: Uber Canada et al.)5
Note: Active = no cancel date on the record. Tow-truck licensing moved to the province in 2024, zeroing 4,848 records. Source: City of Toronto, Municipal Licensing and Standards, business licences, retrieved Oct 8, 2026.
licences.canada.nshipyard.com
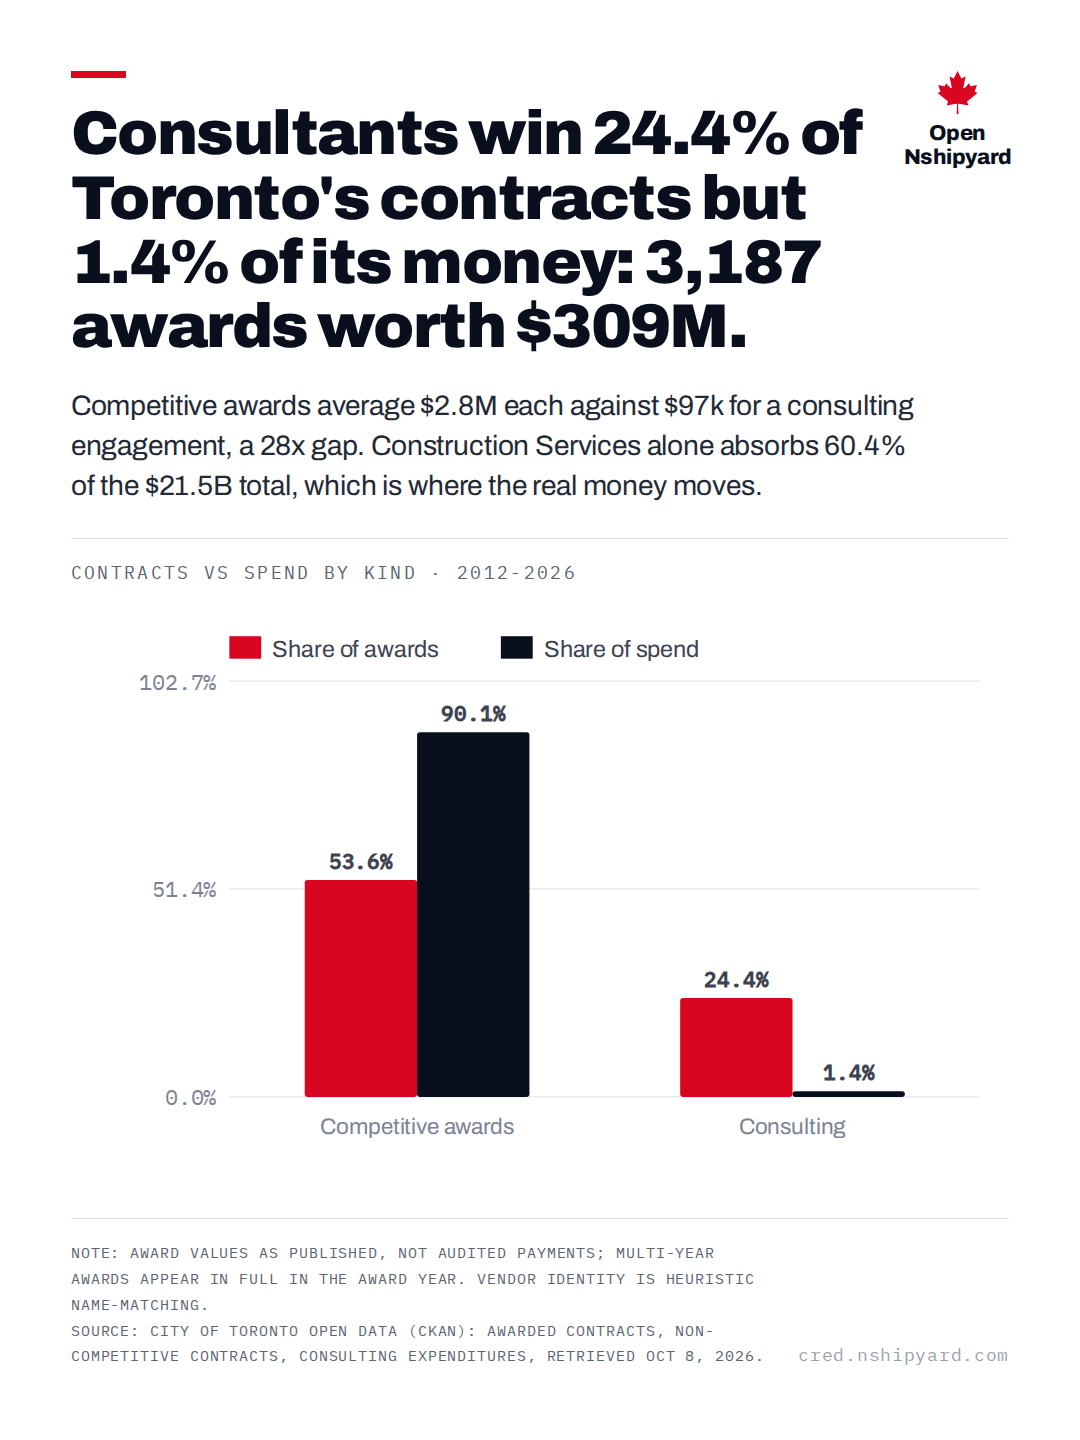
Consultants win 24.4% of Toronto's contracts but 1.4% of its money: 3,187 awards worth $309M.
Open Nshipyard
Competitive awards average $2.8M each against $97k for a consulting engagement, a 28x gap. Construction Services alone absorbs 60.4% of the $21.5B total, which is where the real money moves.
Contracts vs spend by kind · 2012-2026
Note: Award values as published, not audited payments; multi-year awards appear in full in the award year. Vendor identity is heuristic name-matching. Source: City of Toronto open data (CKAN): awarded contracts, non-competitive contracts, consulting expenditures, retrieved Oct 8, 2026.
procurement.canada.nshipyard.com
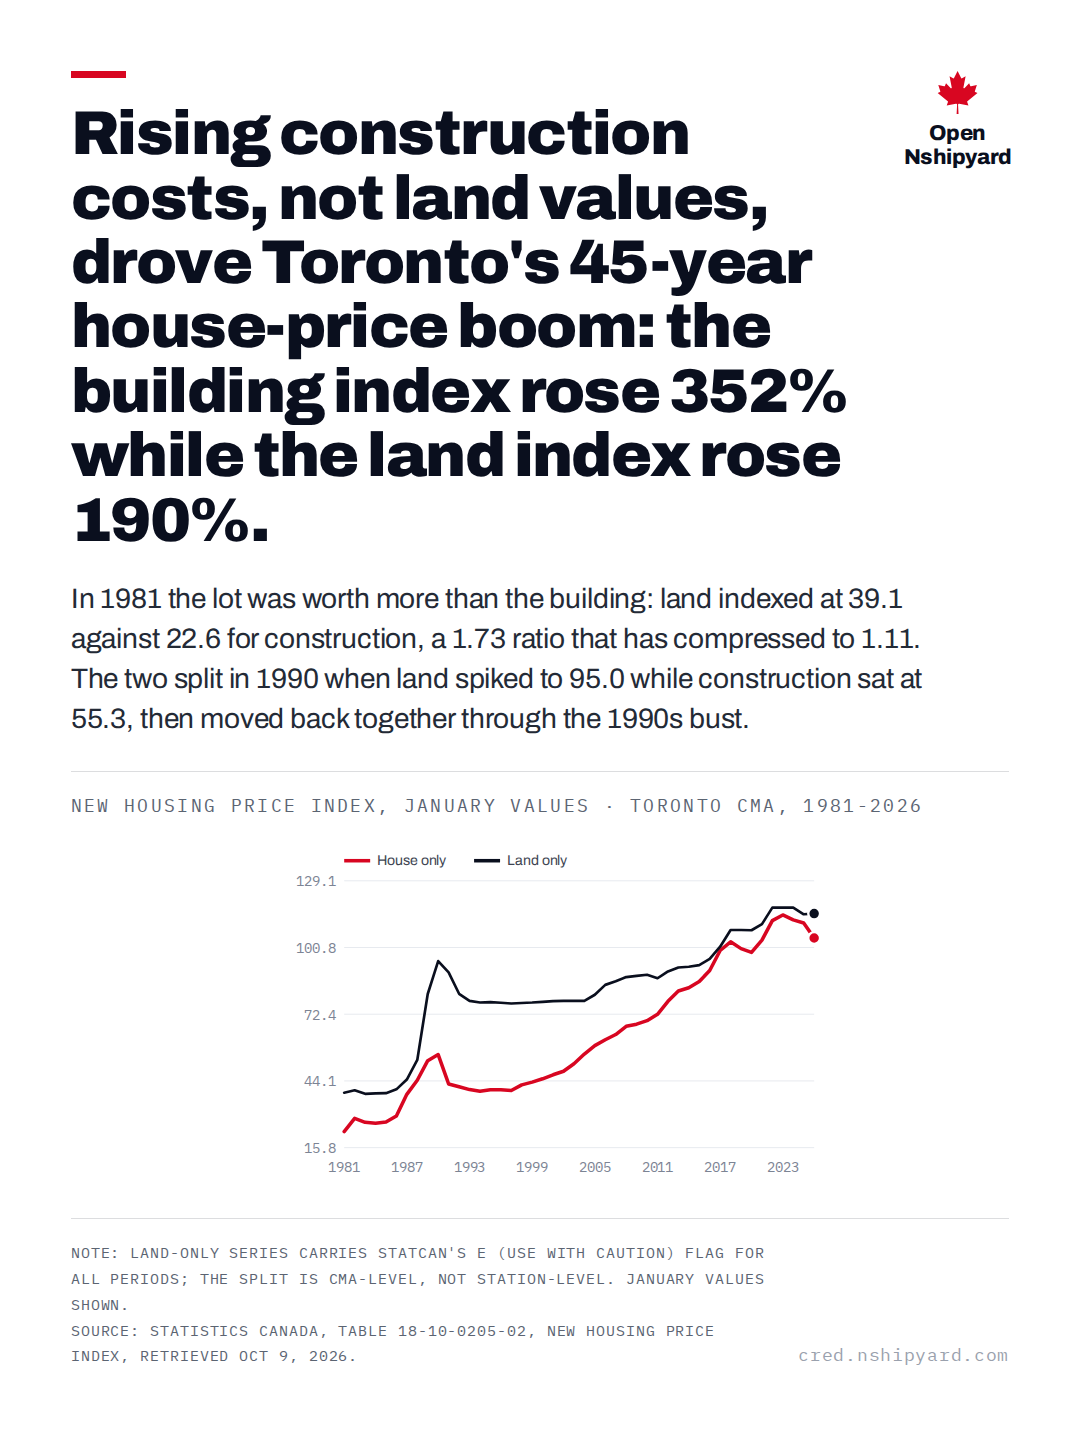
Rising construction costs, not land values, drove Toronto's 45-year house-price boom: the building index rose 352% while the land index rose 190%.
Open Nshipyard
In 1981 the lot was worth more than the building: land indexed at 39.1 against 22.6 for construction, a 1.73 ratio that has compressed to 1.11. The two split in 1990 when land spiked to 95.0 while construction sat at 55.3, then moved back together through the 1990s bust.
New Housing Price Index, January values · Toronto CMA, 1981-2026
Note: Land-only series carries StatCan's E (use with caution) flag for all periods; the split is CMA-level, not station-level. January values shown. Source: Statistics Canada, table 18-10-0205-01, New Housing Price Index, retrieved Oct 9, 2026.
landvalue.canada.nshipyard.com
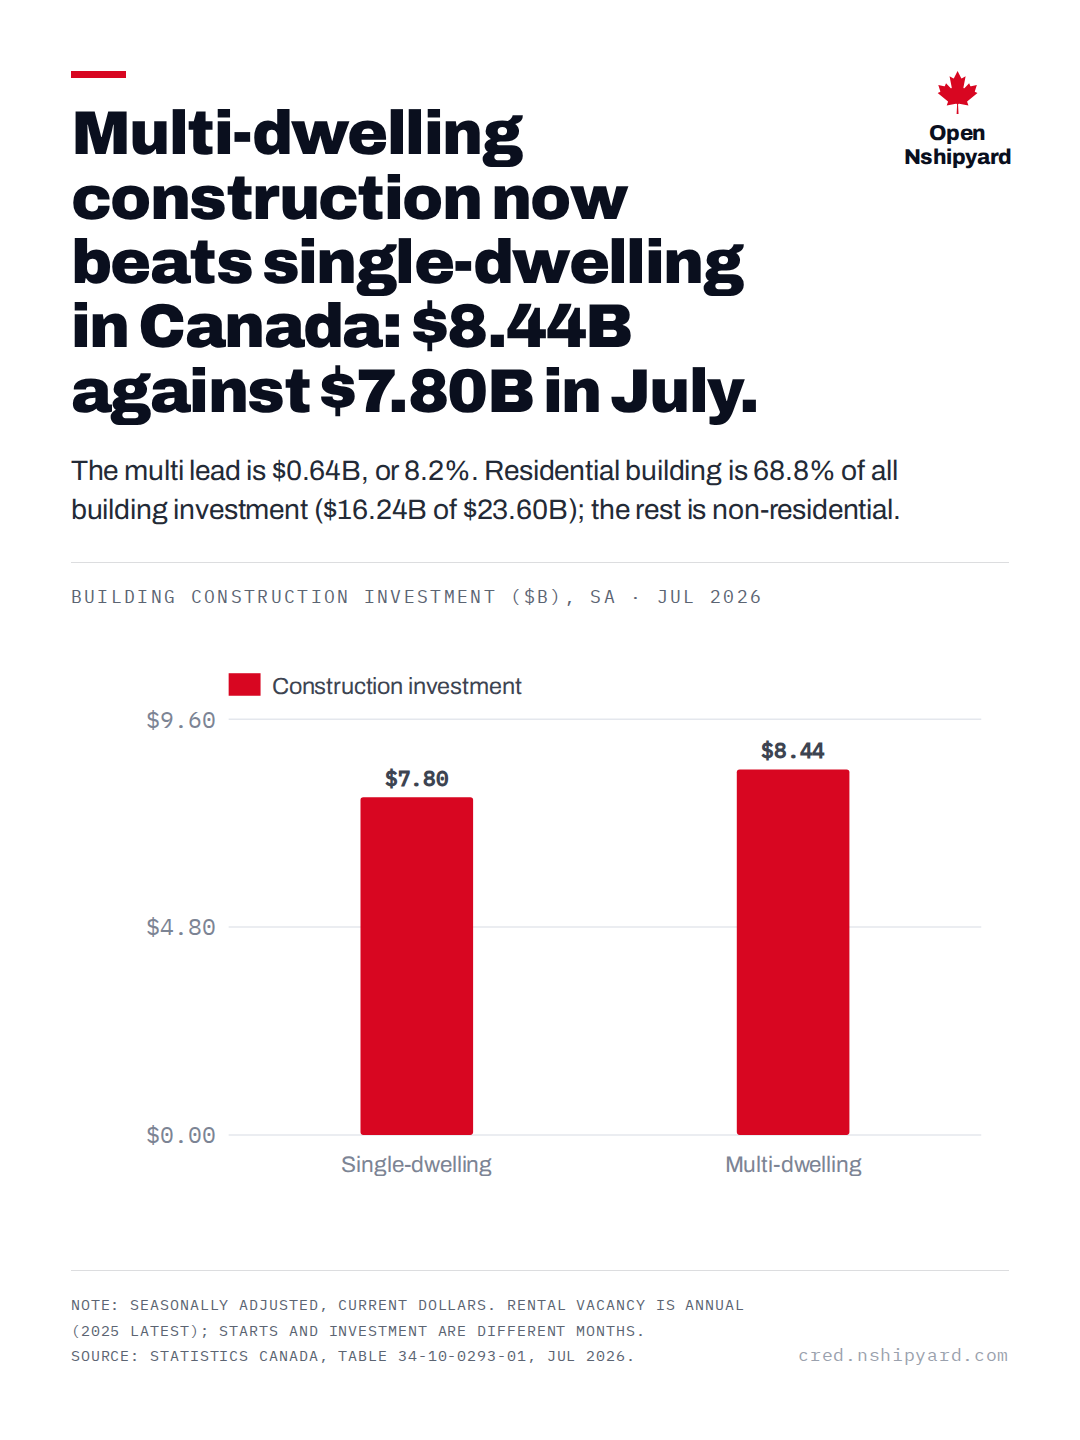
Multi-dwelling construction now beats single-dwelling in Canada: $8.44B against $7.80B in July.
Open Nshipyard
The multi lead is $0.64B, or 8.2%. Residential building is 68.8% of all building investment ($16.24B of $23.60B); the rest is non-residential.
Building construction investment ($B), SA · Jul 2026
Note: Seasonally adjusted, current dollars. Rental vacancy is annual (2025 latest); starts and investment are different months. Source: Statistics Canada, table 34-10-0293-01, Jul 2026.
canada.nshipyard.com
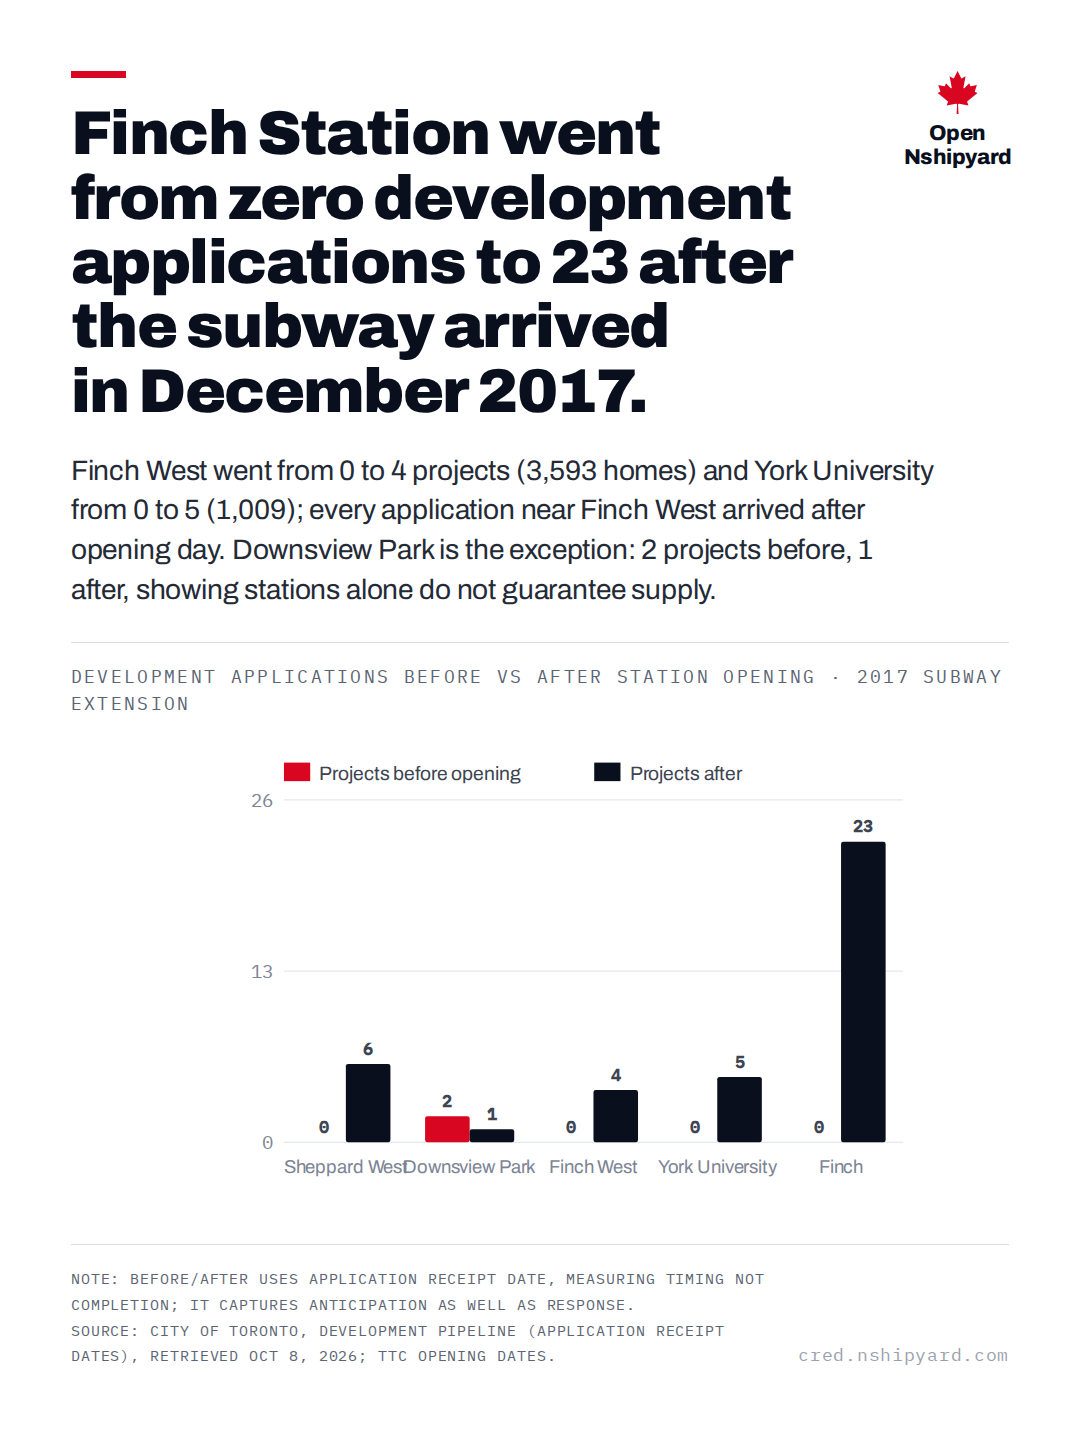
Finch Station went from zero development applications to 23 after the subway arrived in December 2017.
Open Nshipyard
Finch West went from 0 to 4 projects (3,593 homes) and York University from 0 to 5 (1,009); every application near Finch West arrived after opening day. Downsview Park is the exception: 2 projects before, 1 after, showing stations alone do not guarantee supply.
Development applications before vs after station opening · 2017 subway extension
Note: Before/after uses application receipt date, measuring timing not completion; it captures anticipation as well as response. Source: City of Toronto, Development Pipeline (application receipt dates), retrieved Oct 8, 2026; TTC opening dates.
supply.canada.nshipyard.com
Toronto construction costs rose 4.64x since 1981. Union construction wages rose 4.55x, right alongside them. The fastest-rising material, fabricated metal, reached 4.01x.
Open Nshipyard
All three series rebased to 1981=100. Wages (CUWR Toronto, including pay supplements) move with the NHPI house-only index across the full 45 years. National factory-gate materials prices sit below both for the whole period.
Construction cost drivers, rebased 1981=100 · Toronto CMA, 1981-2026
Note: Wages are a union wage-scale proxy for selected Toronto CMA trades, not all-worker earnings. Materials are national IPPI factory-gate prices, shown as upstream input-price shocks, not Toronto builder costs. Source: Statistics Canada, tables 18-10-0205-01, 18-10-0140-01, 18-10-0266-01, extracted Oct 10, 2026.
housing-costs.nshipyard.com
Construction costs rose the most since 1981 at 4.64x. Union wages were right behind at 4.55x. Materials rose less.
Open Nshipyard
Every driver rebased to 1981=100 and ranked by growth. Toronto construction costs and Toronto union wages sit far above national materials prices. This ranks growth, not causal shares: it shows what moved most, not what caused the move.
Cost drivers ranked by growth, 1981=100 · Toronto and Canada, 1981-2026
Note: BCPI and iron/steel are excluded because their series start in 2017 and 2010, so their multiples cannot be compared. Four suspected drivers, development charges, code-compliance costs, productivity, and margins, have no open series and cannot be ranked. Source: Statistics Canada, tables 18-10-0205-01, 18-10-0140-01, 18-10-0266-01, extracted Oct 10, 2026.
housing-costs.nshipyard.com
Construction costs surged ahead of wages twice since 1981: by 77 points in 1990 and 83 in 2017. Wages caught up both times.
Open Nshipyard
The gap between the NHPI house-only index and Toronto union wages swings in waves. Costs ran 77 points ahead in 1990 and 83 ahead in 2017. Wages closed the gap both times, ending 2026 just 9 points behind.
Construction costs minus union wages, index points · Toronto CMA, 1981-2026
Note: Gap in 1981=100 index points, not dollars. Wages are the CUWR Toronto union wage-scale proxy, including pay supplements. Source: Statistics Canada, tables 18-10-0205-01, 18-10-0140-01, extracted Oct 10, 2026.
housing-costs.nshipyard.com
Lumber spiked to 6.2x in 2022, then collapsed to 3.1x. Metal and concrete never spiked. They just kept climbing.
Open Nshipyard
Softwood lumber went from 248 in 2020 to 618 in 2022, then fell back to 311 by 2026. Fabricated metal rose steadily to 4.01x and ready-mixed concrete to 3.66x. The spike everyone remembers was not the story. The quiet climbers were.
Note: National IPPI factory-gate prices, shown as upstream input-price shocks, not Toronto builder costs. Source: Statistics Canada, table 18-10-0266-01, extracted Oct 10, 2026.
housing-costs.nshipyard.com
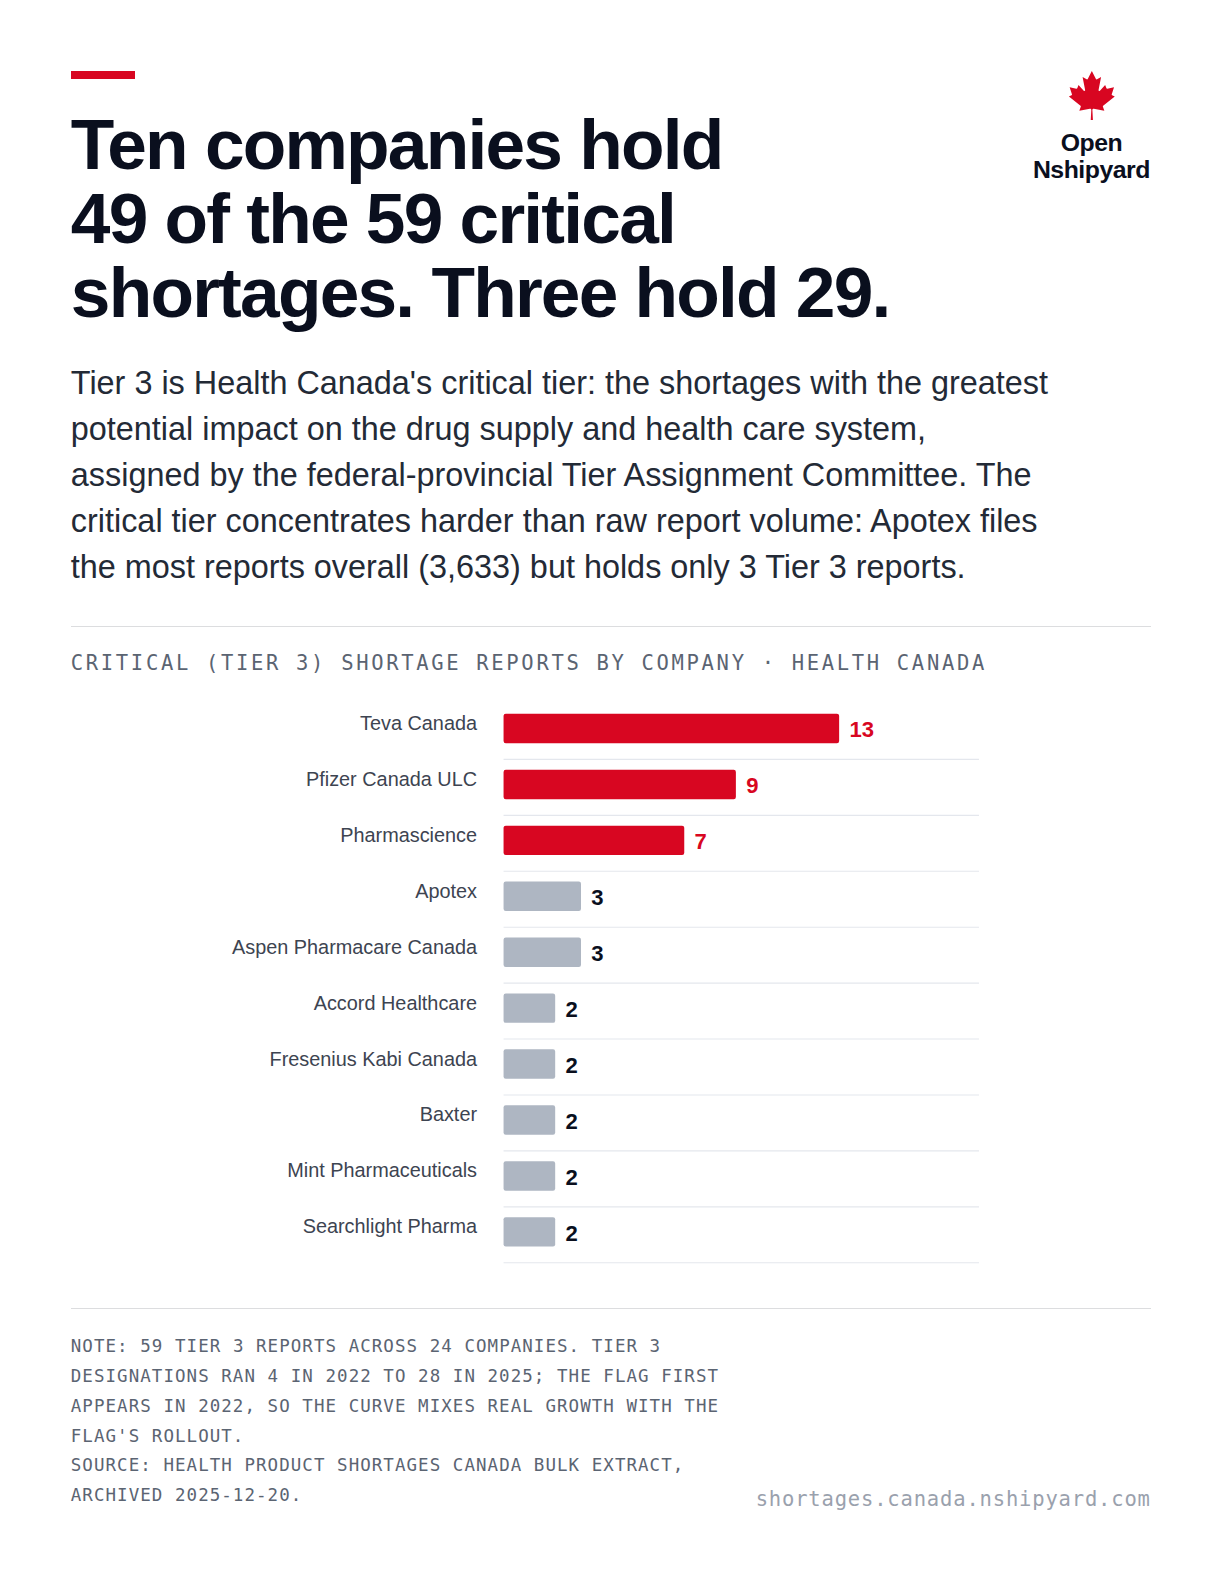
Ten companies hold 49 of Canada's 59 critical drug shortages. Three hold 29.
Open Nshipyard
Tier 3 is Health Canada's critical tier: the shortages with the greatest potential impact on the drug supply and health care system, assigned by the federal-provincial Tier Assignment Committee. The critical tier concentrates harder than raw report volume: Apotex files the most reports overall (3,633) but holds only 3 Tier 3 reports.
Critical (Tier 3) shortage reports by company · Health Canada
Note: 59 Tier 3 reports across 24 companies. Tier 3 designations ran 4 in 2022 to 28 in 2025; the flag first appears in 2022, so the curve mixes real growth with the flag's rollout. Source: Health Product Shortages Canada bulk extract, archived 2025-12-20.
shortages.canada.nshipyard.com
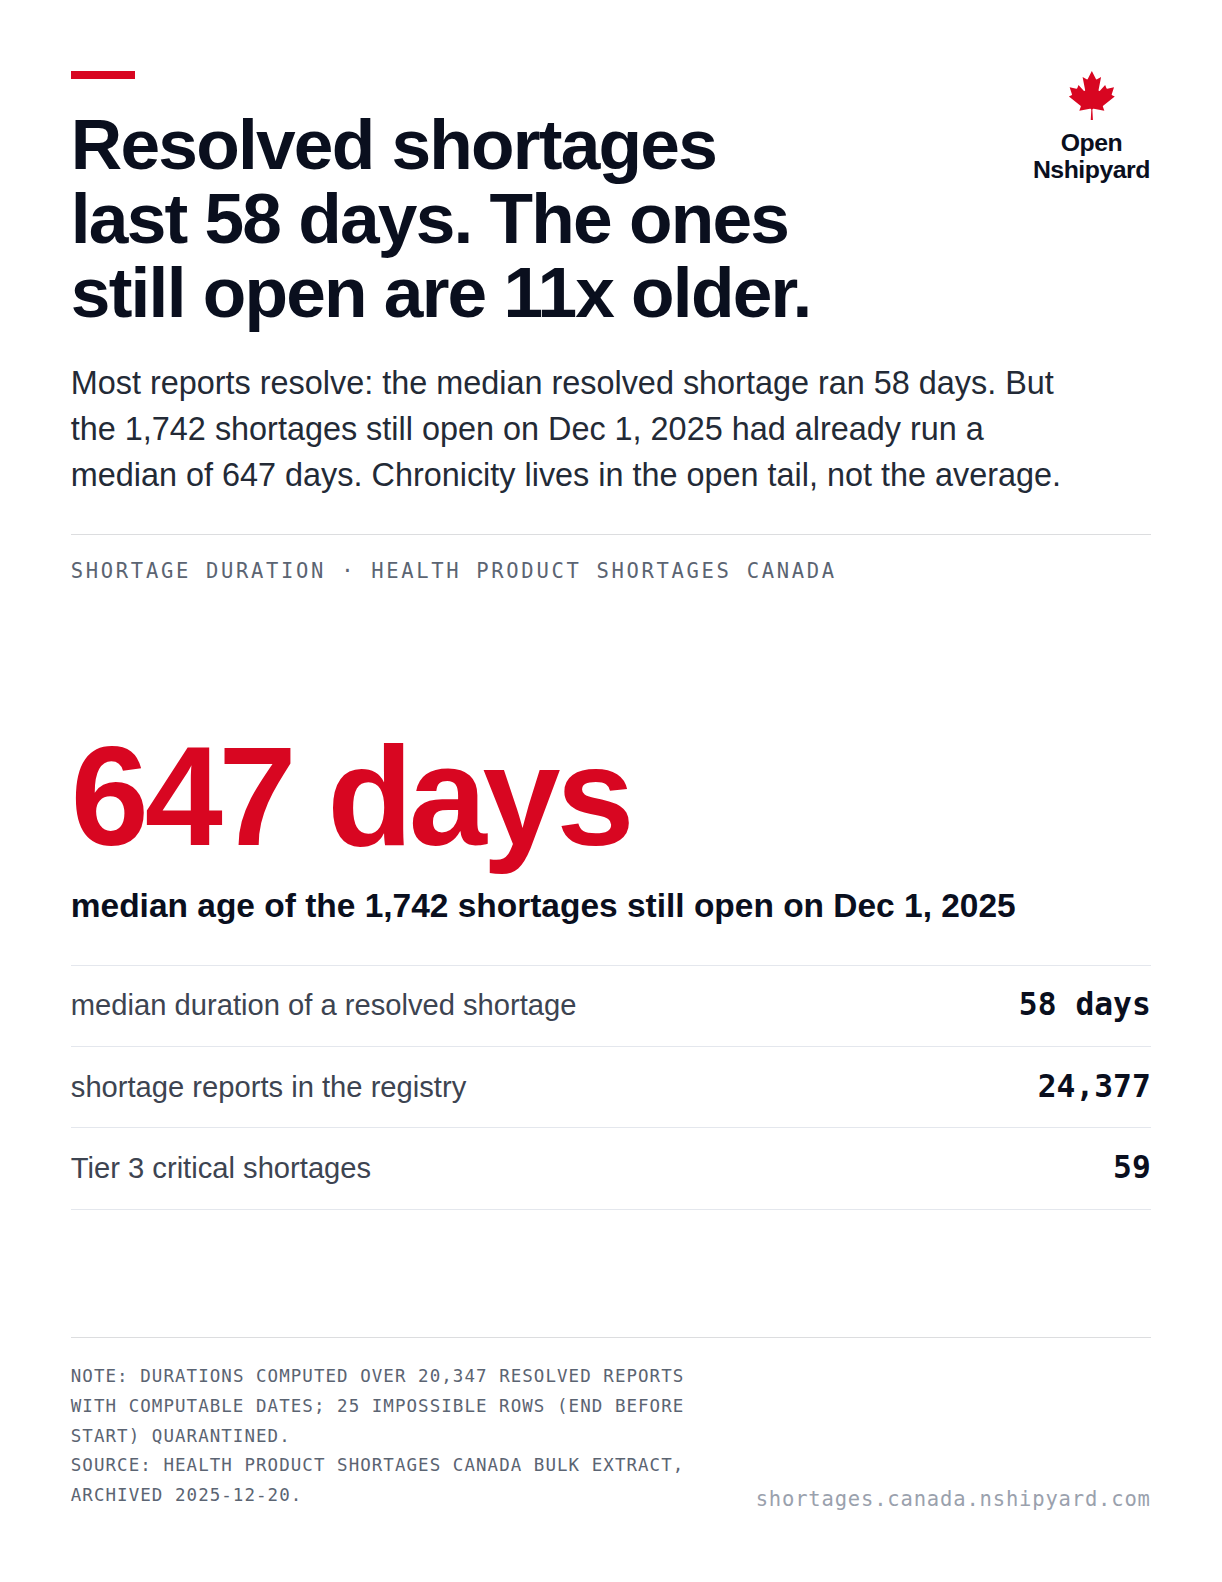
Resolved shortages last 58 days. The ones still open are 11x older.
Open Nshipyard
Most reports resolve: the median resolved shortage ran 58 days. But the 1,742 shortages still open on Dec 1, 2025 had already run a median of 647 days. Chronicity lives in the open tail, not the average.
Shortage duration · Health Product Shortages Canada
647 days
median age of the 1,742 shortages still open on Dec 1, 2025
median duration of a resolved shortage58 days
shortage reports in the registry24,377
Tier 3 critical shortages59
Note: Durations computed over 20,347 resolved reports with computable dates; 25 impossible rows (end before start) quarantined. Source: Health Product Shortages Canada bulk extract, archived 2025-12-20.
shortages.canada.nshipyard.com
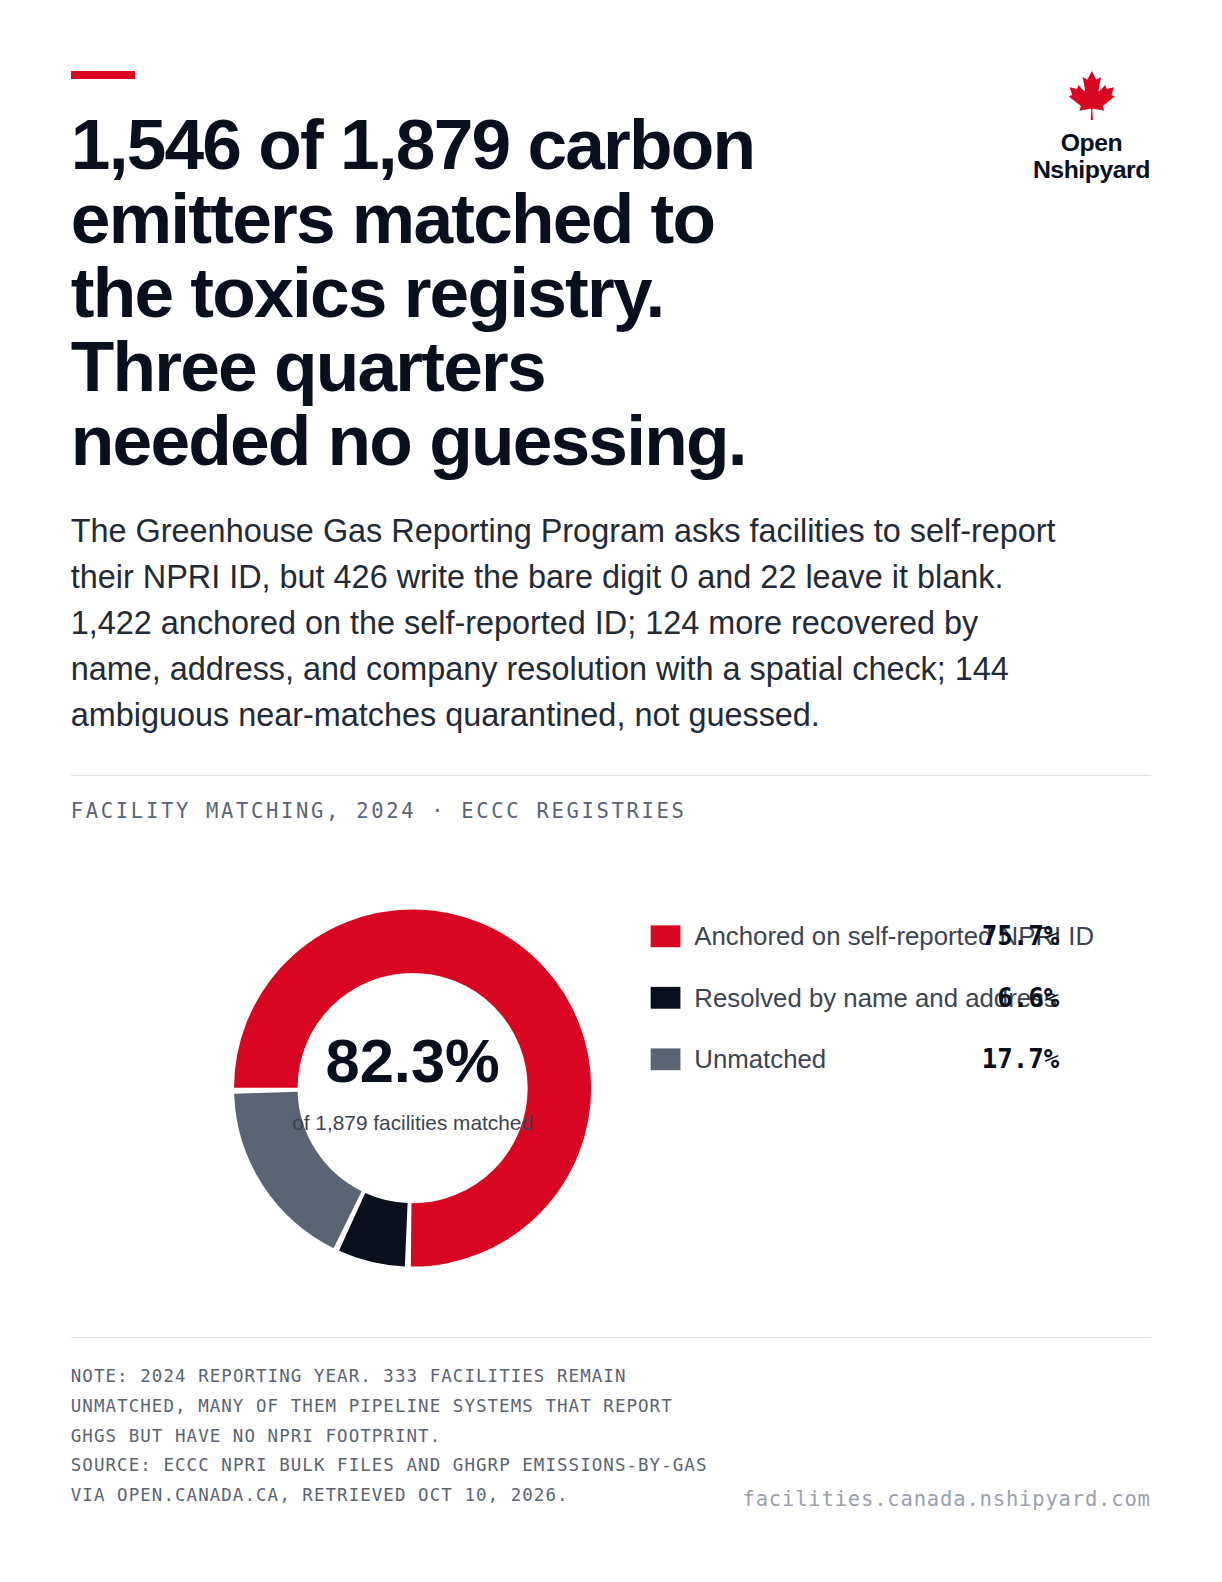
1,546 of 1,879 carbon emitters matched to the toxics registry. Three in four matched on the ID the facility reported itself.
Open Nshipyard
The Greenhouse Gas Reporting Program asks facilities to self-report their NPRI ID, but 426 write the bare digit 0 and 22 leave it blank. 1,422 anchored on the self-reported ID; 124 more recovered by name, address, and company resolution with a spatial check; 144 ambiguous near-matches quarantined, not guessed.
Facility matching, 2024 · ECCC registries
Note: 2024 reporting year. 333 facilities remain unmatched, many of them pipeline systems that report GHGs but have no NPRI footprint. Source: ECCC NPRI bulk files and GHGRP emissions-by-gas via open.canada.ca, retrieved Oct 10, 2026.
facilities.canada.nshipyard.com
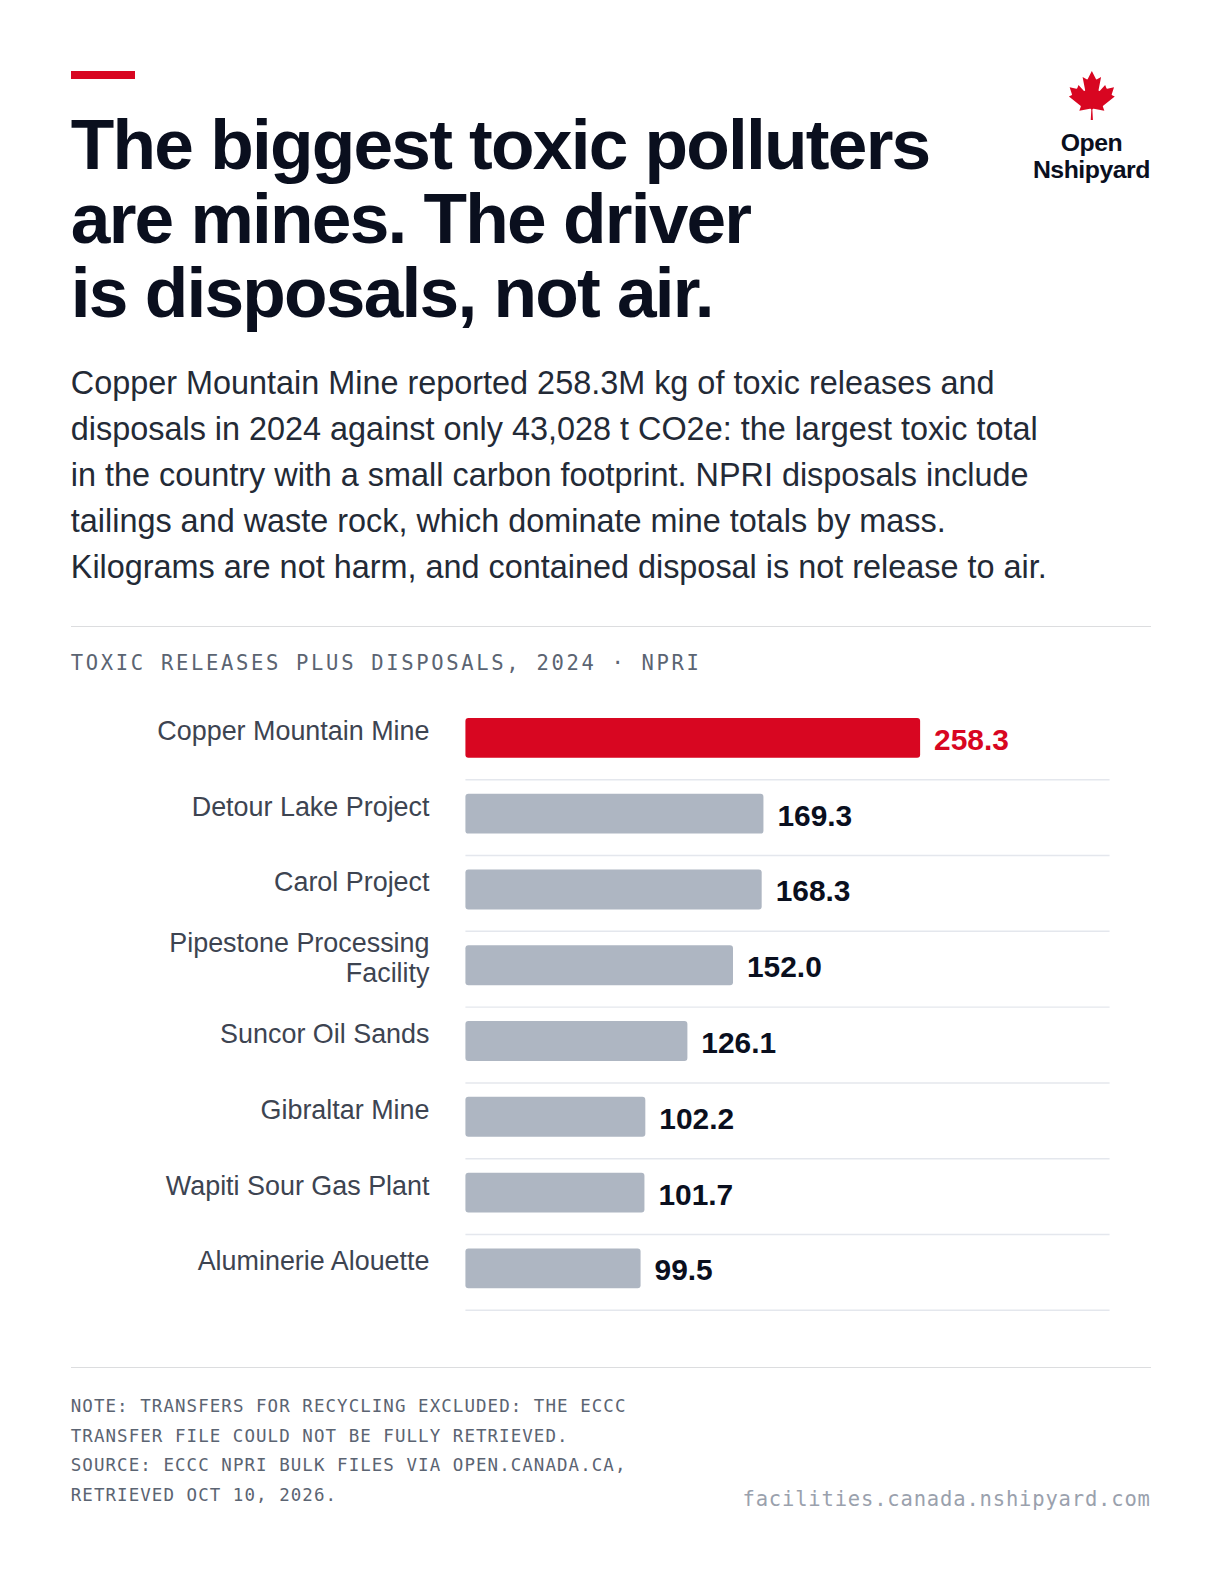
The biggest toxic polluters are mines. The driver is disposals, not air.
Open Nshipyard
Copper Mountain Mine reported 258.3M kg of toxic releases and disposals in 2024 against only 43,028 t CO2e: the largest toxic total in the country with a small carbon footprint. NPRI disposals include tailings and waste rock, which dominate mine totals by mass. Kilograms are not harm, and contained disposal is not release to air.
Toxic releases plus disposals, 2024 · NPRI
Note: Transfers for recycling excluded: the ECCC transfer file could not be fully retrieved. Source: ECCC NPRI bulk files via open.canada.ca, retrieved Oct 10, 2026.
facilities.canada.nshipyard.com
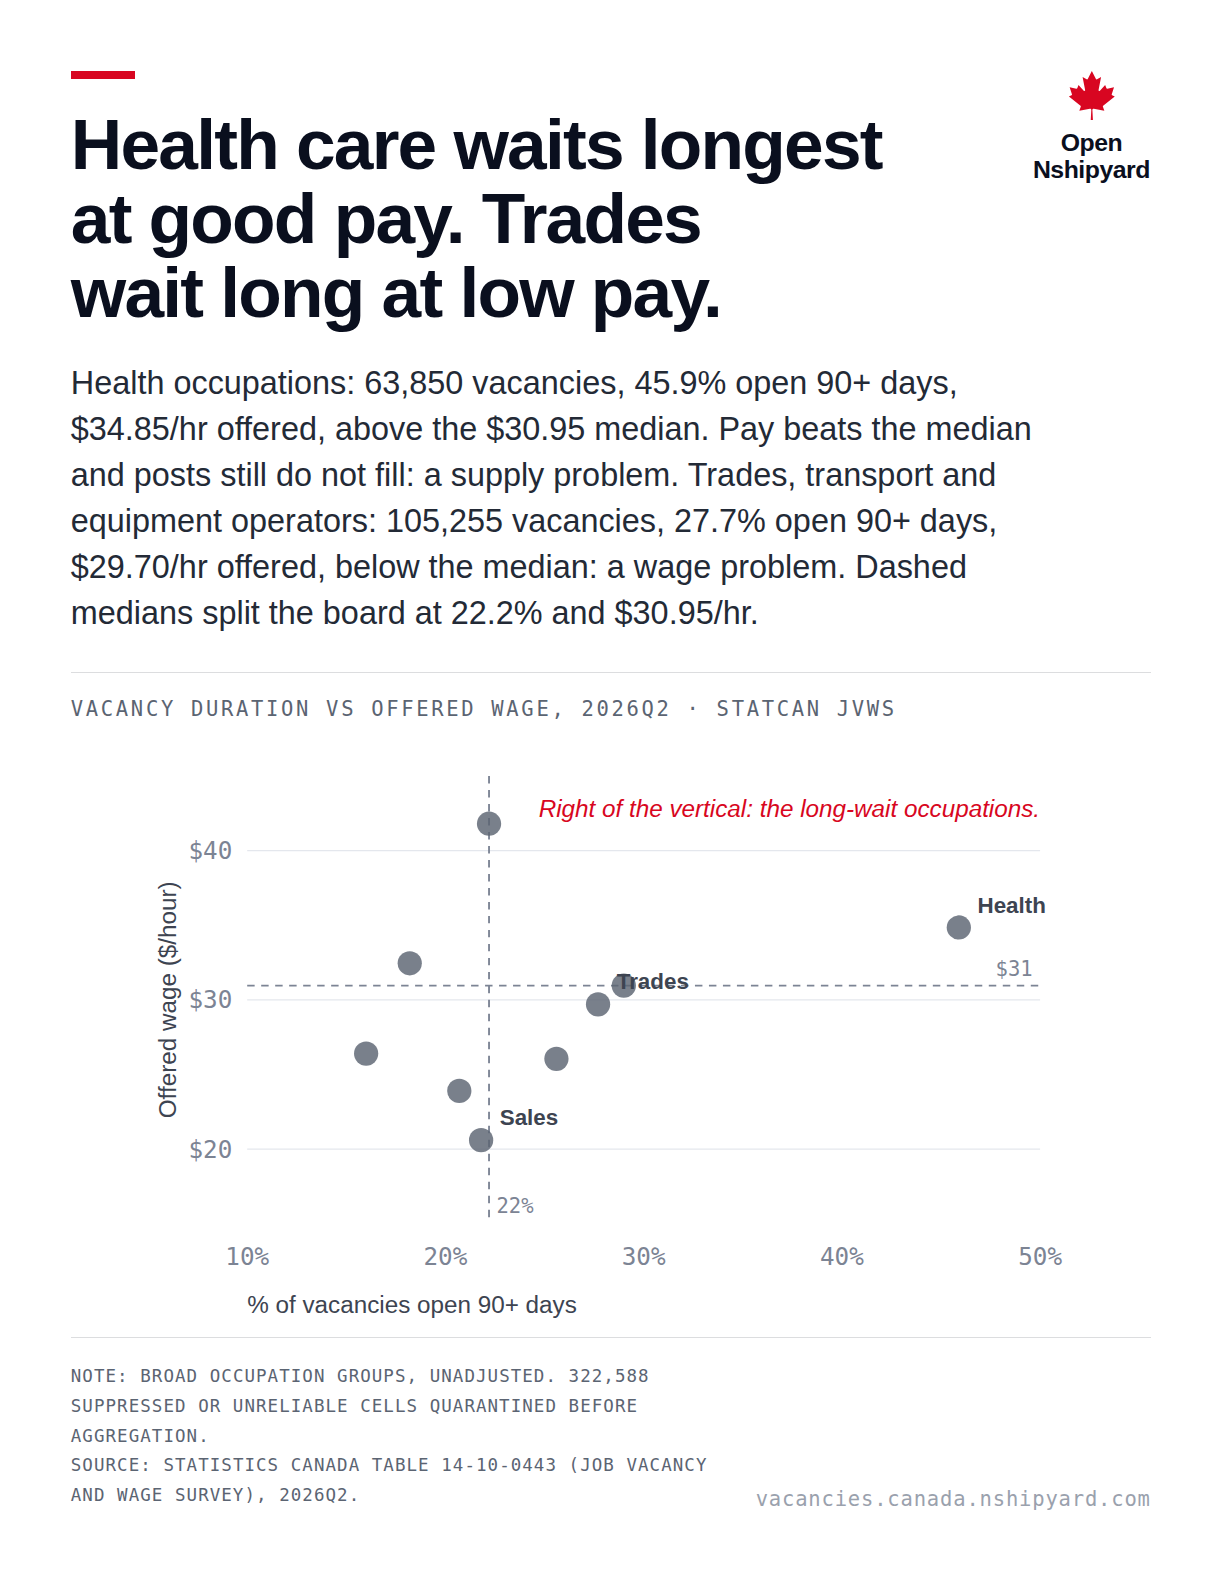
Health jobs go unfilled longest despite above-median pay. Trades jobs go unfilled because pay is below median.
Open Nshipyard
Health occupations: 63,850 vacancies, 45.9% open 90+ days, $34.85/hr offered, above the $30.95 median. Pay beats the median and posts still do not fill: a supply problem. Trades, transport and equipment operators: 105,255 vacancies, 27.7% open 90+ days, $29.70/hr offered, below the median: a wage problem. Dashed medians split the board at 22.2% and $30.95/hr.
Vacancy duration vs offered wage, 2026Q2 · StatCan JVWS
Note: Broad occupation groups, unadjusted. 322,588 suppressed or unreliable cells quarantined before aggregation. Source: Statistics Canada table 14-10-0443 (Job Vacancy and Wage Survey), 2026Q2.
vacancies.canada.nshipyard.com
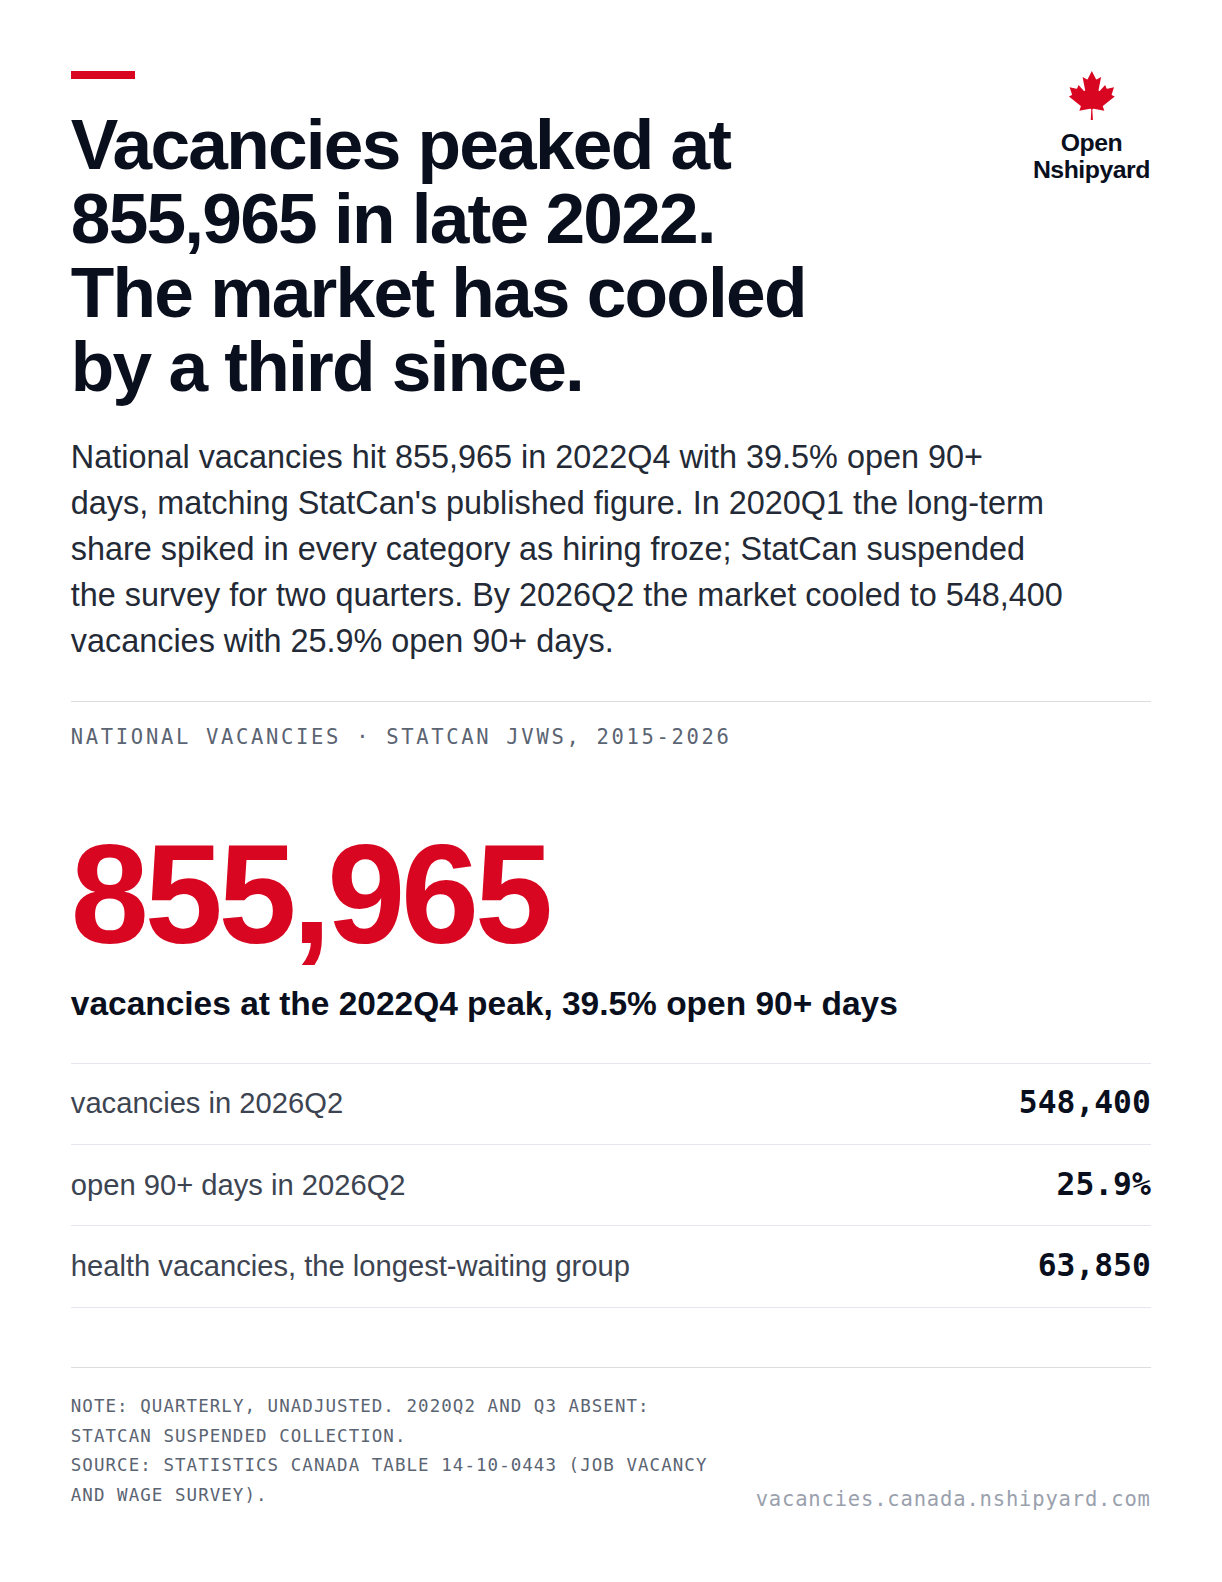
Vacancies peaked at 855,965 in late 2022. The market has cooled by a third since.
Open Nshipyard
National vacancies hit 855,965 in 2022Q4 with 39.5% open 90+ days, matching StatCan's published figure. In 2020Q1 the long-term share spiked in every category as hiring froze; StatCan suspended the survey for two quarters. By 2026Q2 the market cooled to 548,400 vacancies with 25.9% open 90+ days.
National vacancies · StatCan JVWS, 2015-2026
855,965
vacancies at the 2022Q4 peak, 39.5% open 90+ days
vacancies in 2026Q2548,400
open 90+ days in 2026Q225.9%
health vacancies, the longest-waiting group63,850
Note: Quarterly, unadjusted. 2020Q2 and Q3 absent: StatCan suspended collection. Source: Statistics Canada table 14-10-0443 (Job Vacancy and Wage Survey).
vacancies.canada.nshipyard.com
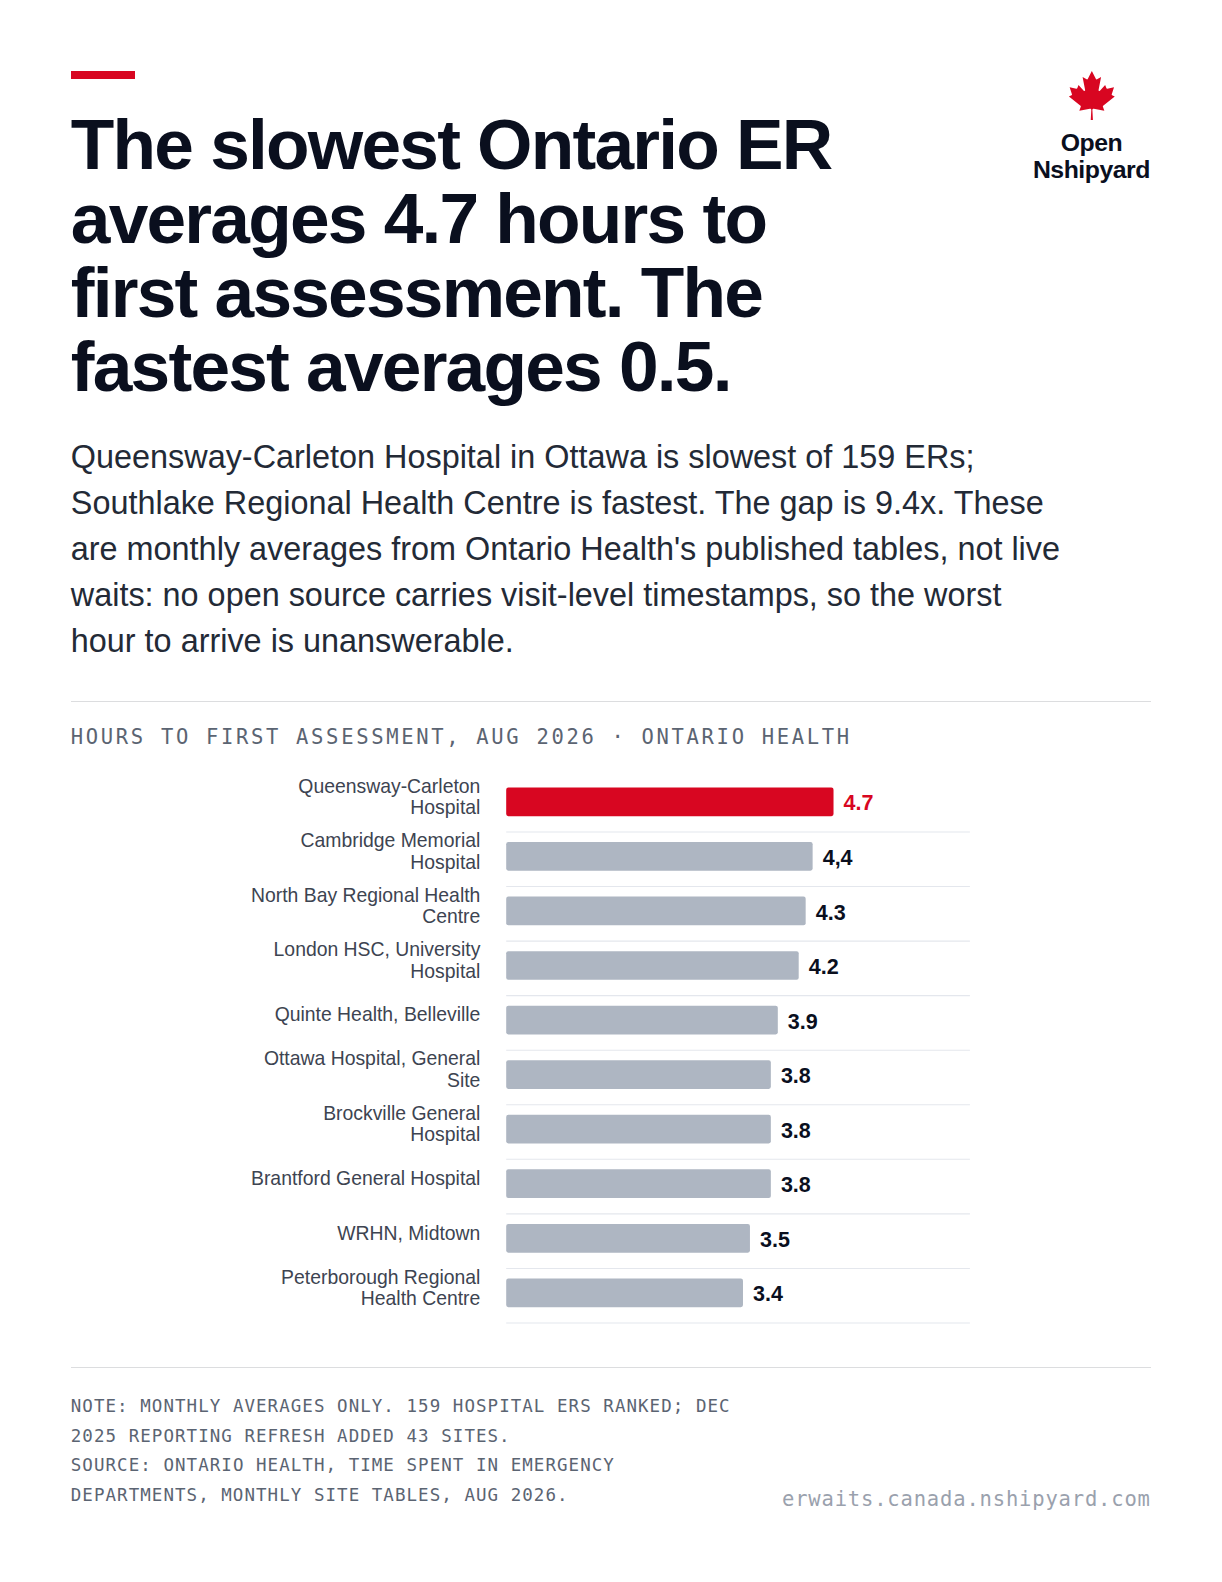
The slowest Ontario ER averages 4.7 hours to first assessment. The fastest averages 0.5.
Open Nshipyard
Queensway-Carleton Hospital in Ottawa is slowest of 159 ERs; Southlake Regional Health Centre is fastest. The gap is 9.4x. These are monthly averages from Ontario Health's published tables, not live waits: no open source carries visit-level timestamps, so the worst hour to arrive is unanswerable.
Hours to first assessment, Aug 2026 · Ontario Health
Note: Monthly averages only. 159 hospital ERs ranked; Dec 2025 reporting refresh added 43 sites. Source: Ontario Health, Time Spent in Emergency Departments, monthly site tables, Aug 2026.
erwaits.canada.nshipyard.com
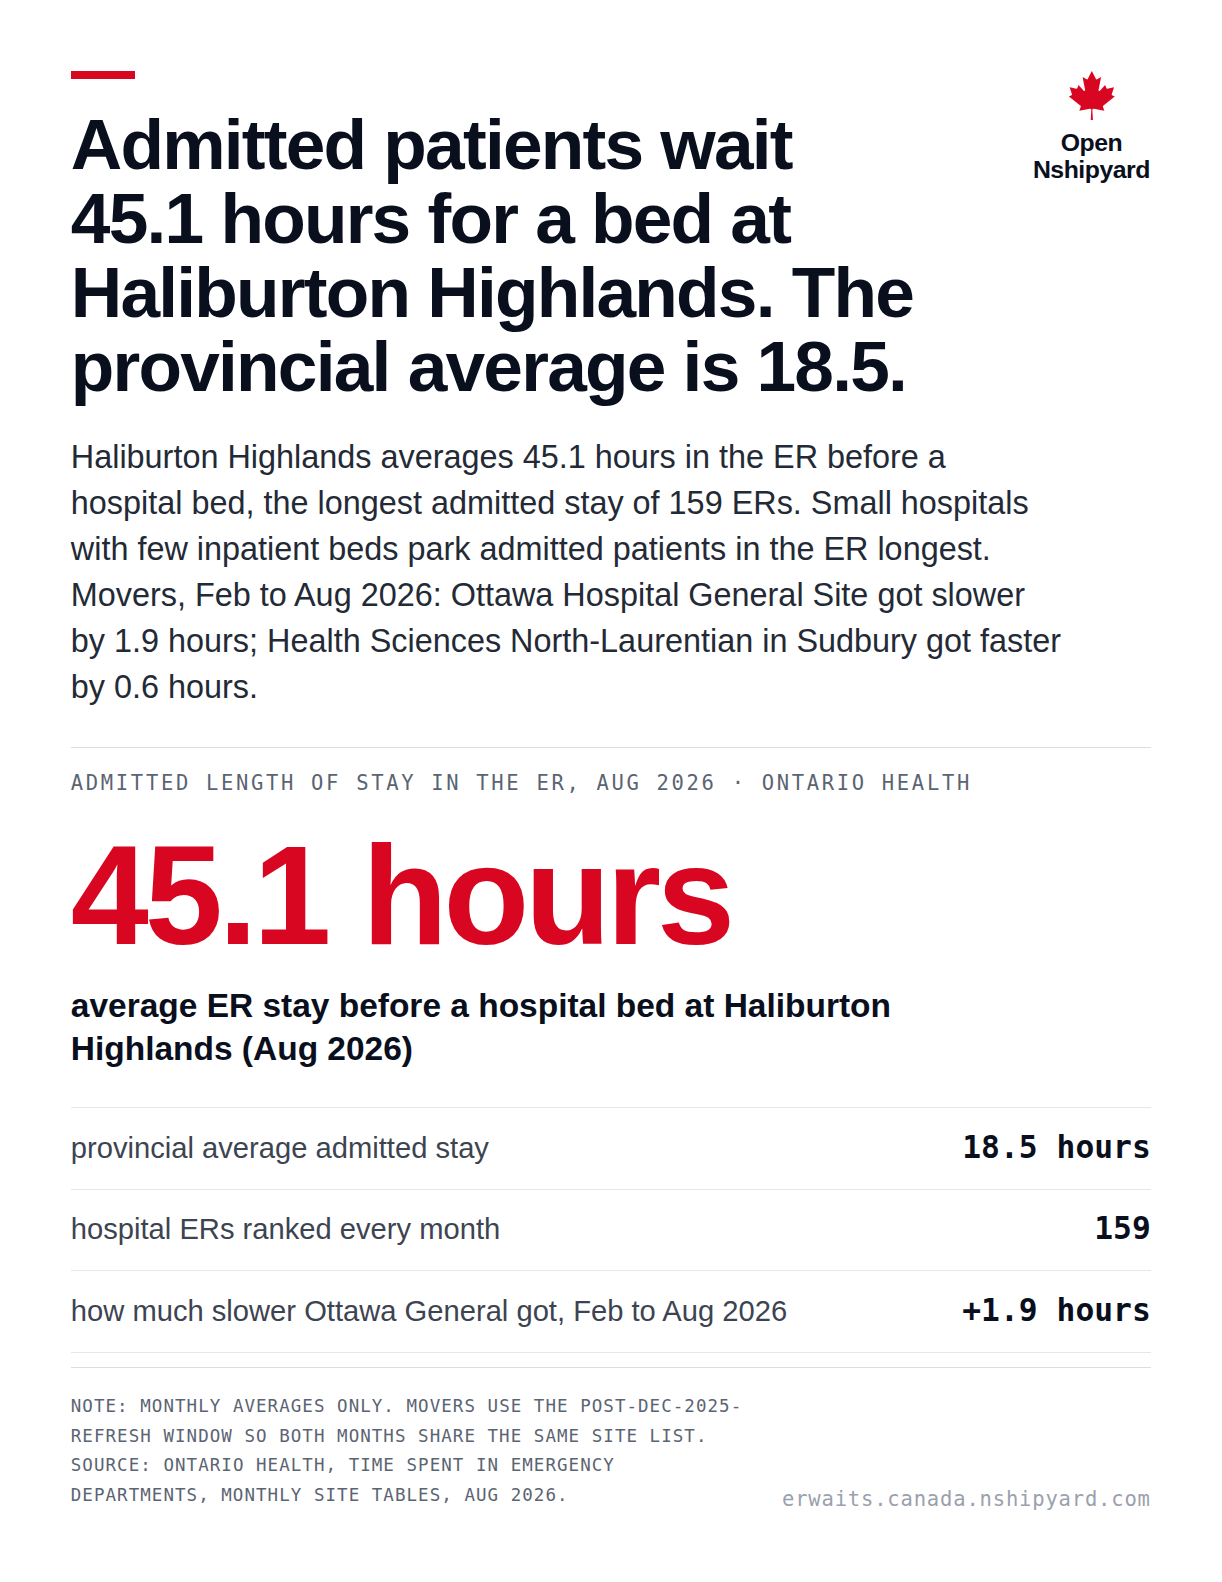
Admitted patients wait 45.1 hours for a bed at Haliburton Highlands. The provincial average is 18.5.
Open Nshipyard
Haliburton Highlands averages 45.1 hours in the ER before a hospital bed, the longest admitted stay of 159 ERs. Small hospitals with few inpatient beds park admitted patients in the ER longest. Movers, Feb to Aug 2026: Ottawa Hospital General Site got slower by 1.9 hours; Health Sciences North-Laurentian in Sudbury got faster by 0.6 hours.
Admitted length of stay in the ER, Aug 2026 · Ontario Health
45.1 hours
average ER stay before a hospital bed at Haliburton Highlands (Aug 2026)
provincial average admitted stay18.5 hours
hospital ERs ranked every month159
how much slower Ottawa General got, Feb to Aug 2026+1.9 hours
Note: Monthly averages only. Movers use the post-Dec-2025-refresh window so both months share the same site list. Source: Ontario Health, Time Spent in Emergency Departments, monthly site tables, Aug 2026.
erwaits.canada.nshipyard.com
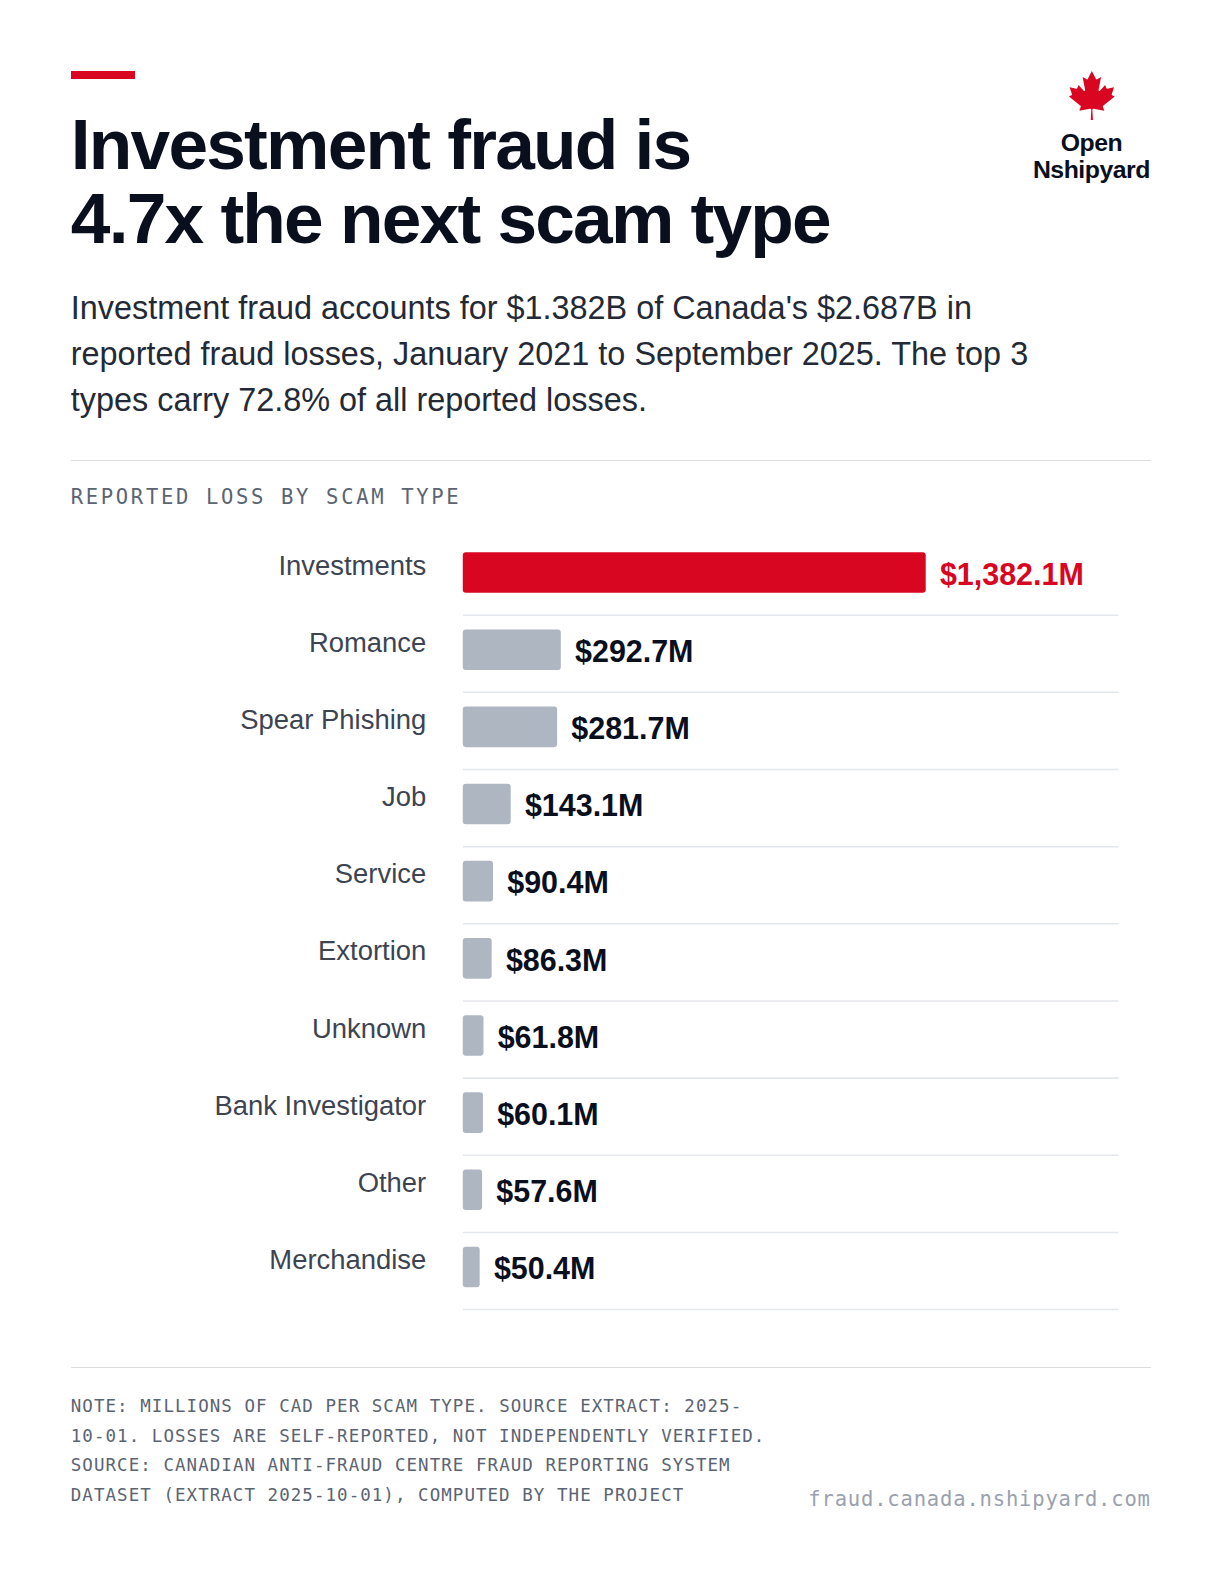
Investment fraud is 4.7x the next scam type
Open Nshipyard
Investment fraud accounts for $1.382B of Canada's $2.687B in reported fraud losses, January 2021 to September 2025. The top 3 types carry 72.8% of all reported losses.
Reported loss by scam type
Note: Millions of CAD per scam type. Source extract: 2025-10-01. Losses are self-reported, not independently verified. Source: Canadian Anti-Fraud Centre Fraud Reporting System Dataset (extract 2025-10-01), computed by the project
fraud.canada.nshipyard.com
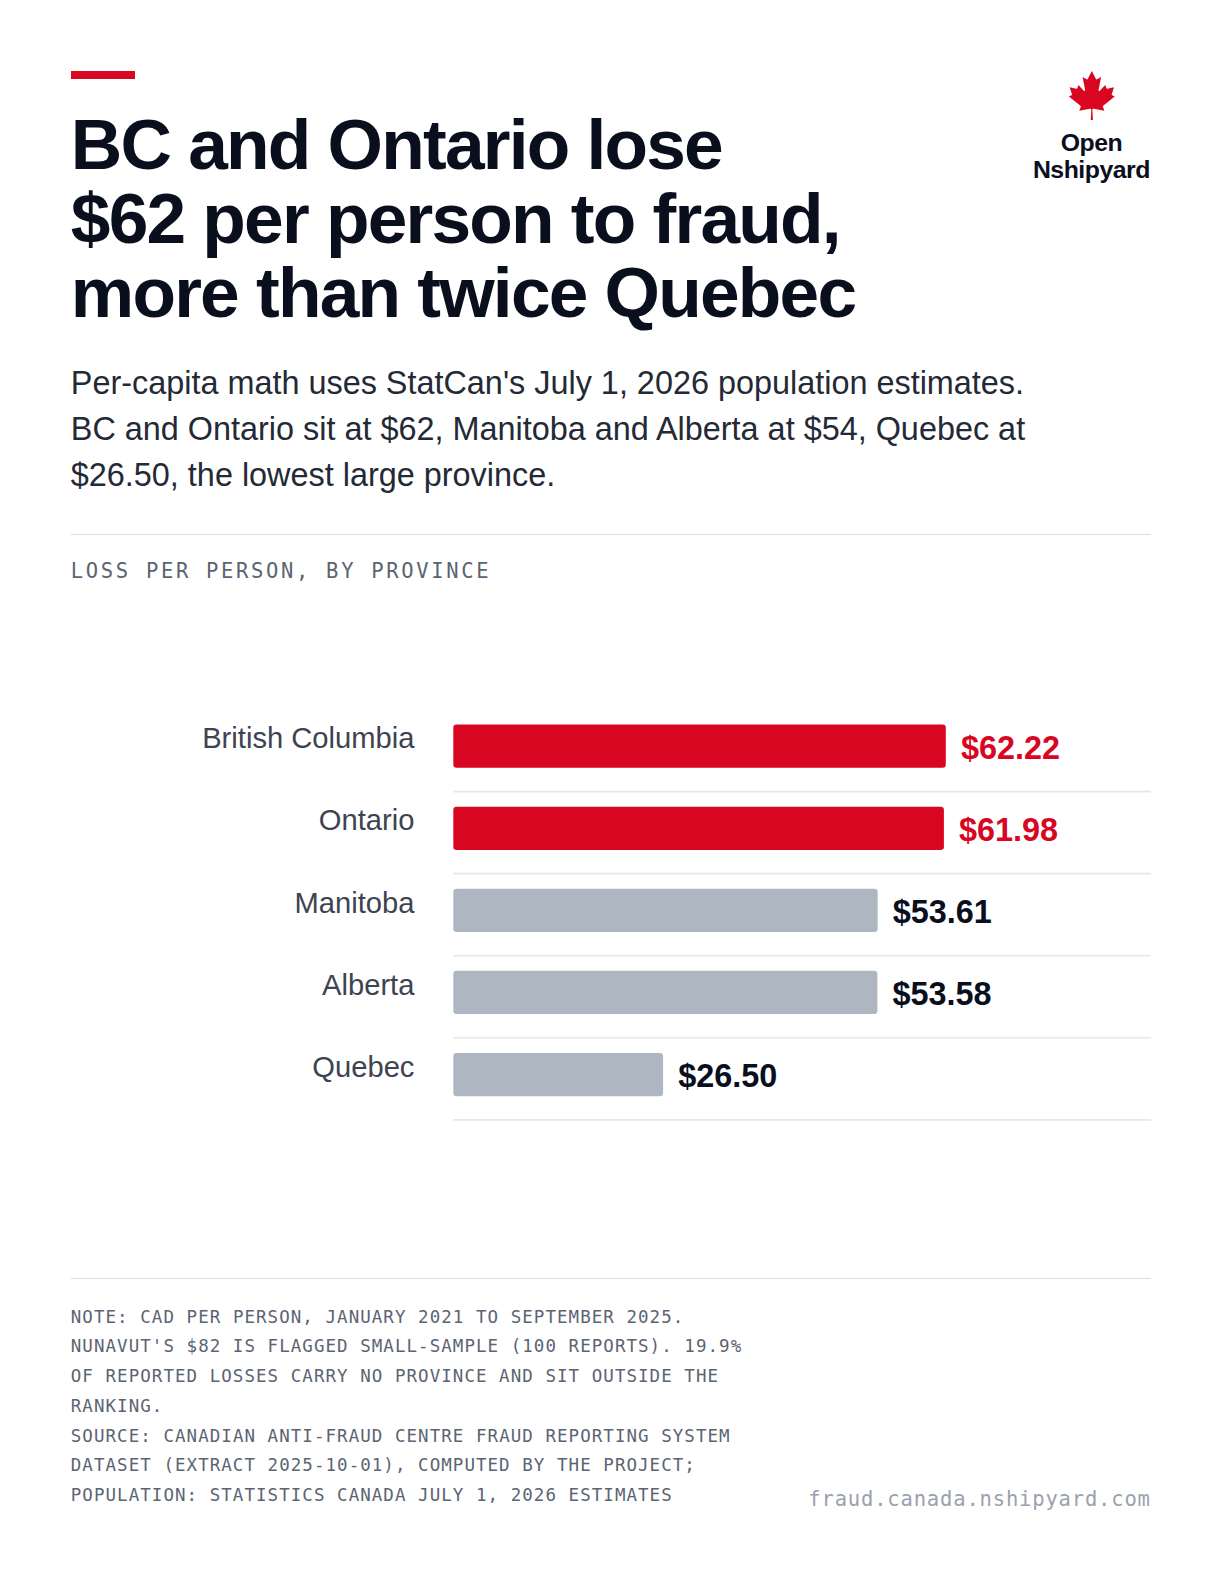
BC and Ontario lose $62 per person to fraud, more than twice Quebec
Open Nshipyard
Per-capita math uses StatCan's July 1, 2026 population estimates. BC and Ontario sit at $62, Manitoba and Alberta at $54, Quebec at $26.50, the lowest large province.
Loss per person, by province
Note: CAD per person, January 2021 to September 2025. Nunavut's $82 is flagged small-sample (100 reports). 19.9% of reported losses carry no province and sit outside the ranking. Source: Canadian Anti-Fraud Centre Fraud Reporting System Dataset (extract 2025-10-01), computed by the project; population: Statistics Canada July 1, 2026 estimates
fraud.canada.nshipyard.com
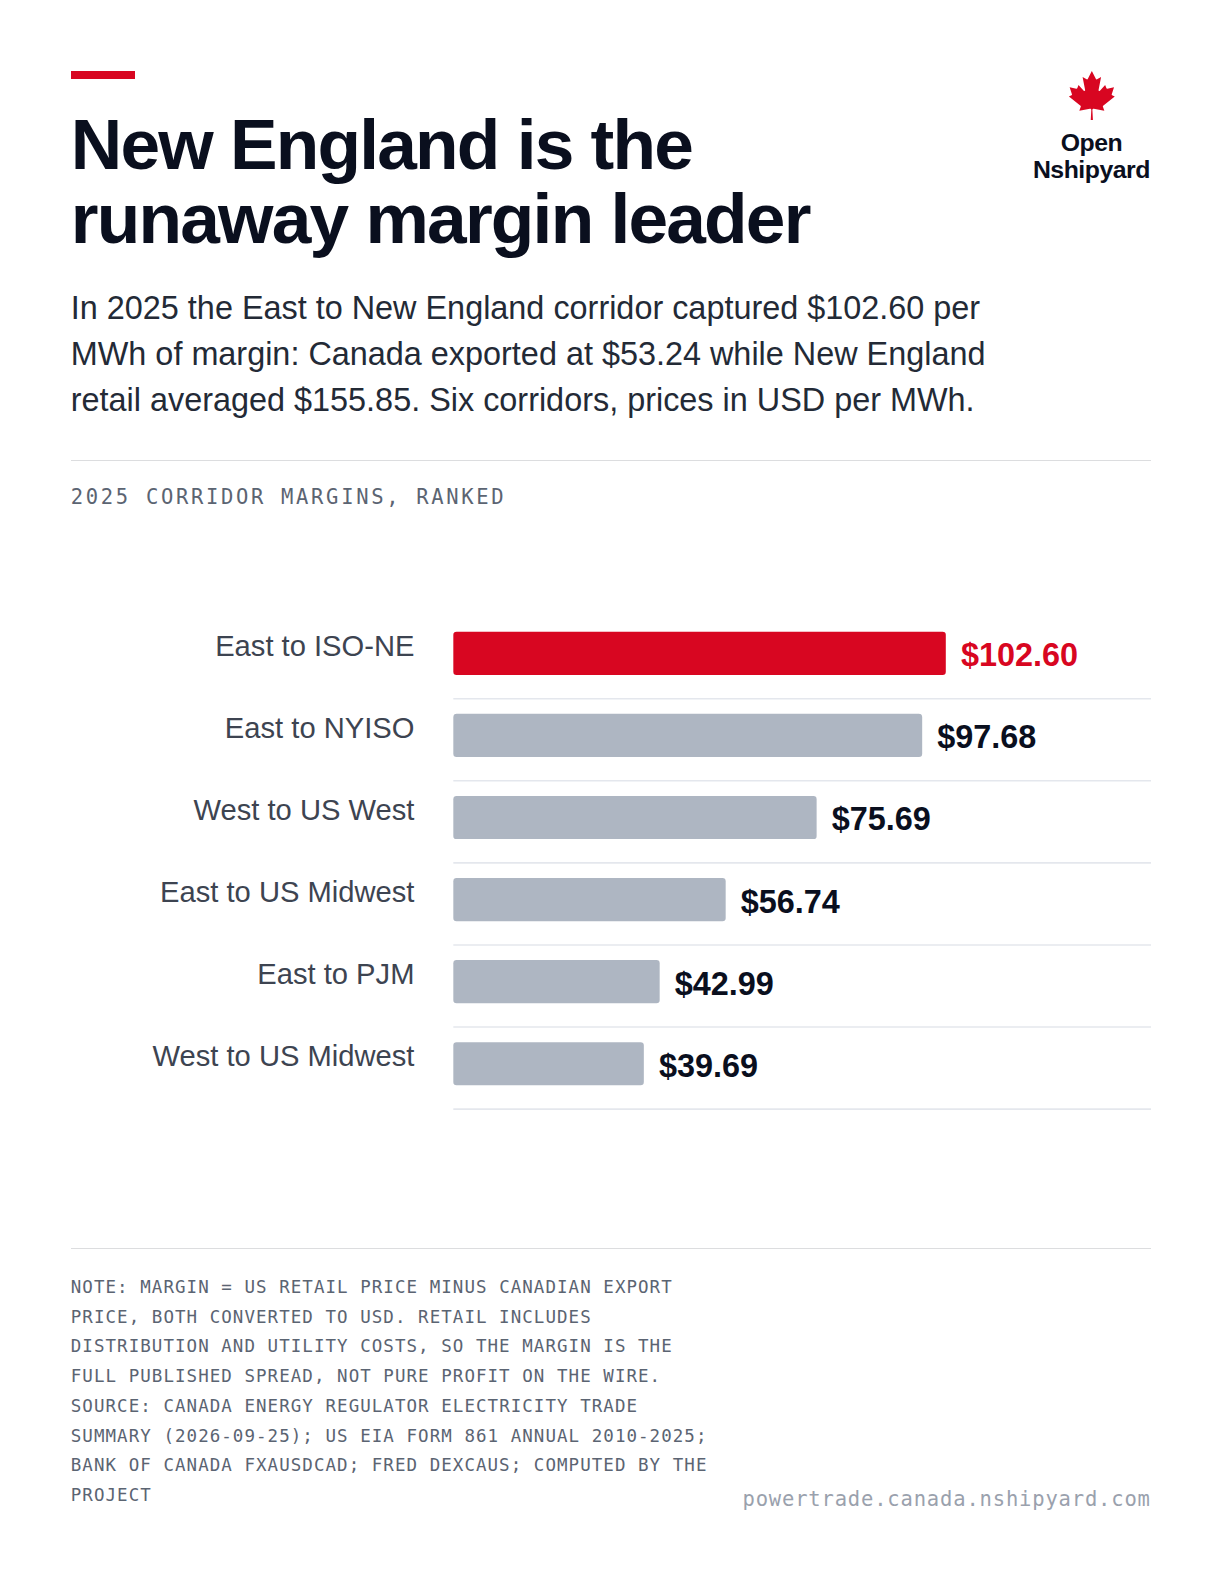
New England captures the widest margin on Canadian electricity: $102.60 per MWh
Open Nshipyard
In 2025 the East to New England corridor captured $102.60 per MWh of margin: Canada exported at $53.24 while New England retail averaged $155.85. Six corridors, prices in USD per MWh.
2025 corridor margins, ranked
Note: Margin = US retail price minus Canadian export price, both converted to USD. Retail includes distribution and utility costs, so the margin is the full published spread, not pure profit on the wire. Source: Canada Energy Regulator Electricity Trade Summary (2026-09-25); US EIA Form 861 annual 2010-2025; Bank of Canada FXAUSDCAD; FRED DEXCAUS; computed by the project
powertrade.canada.nshipyard.com
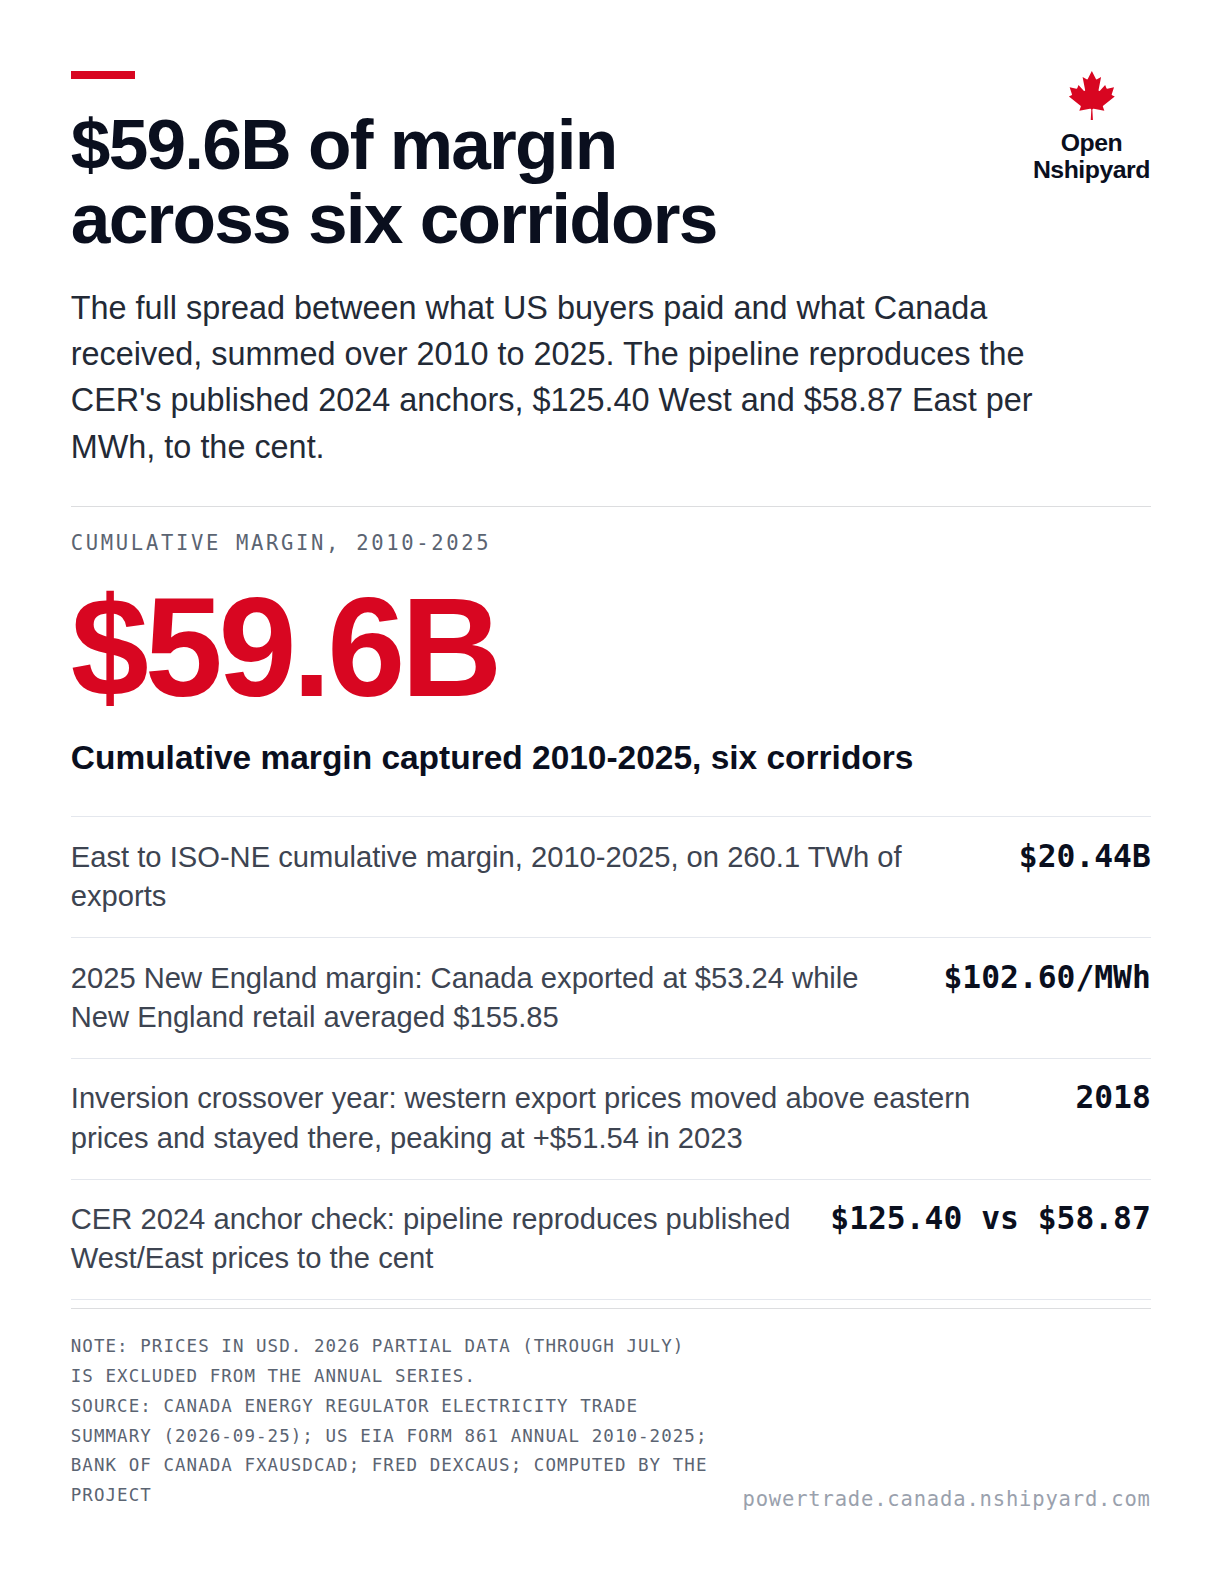
$59.6B of margin across six corridors
Open Nshipyard
The full spread between what US buyers paid and what Canada received, summed over 2010 to 2025. The pipeline reproduces the CER's published 2024 anchors, $125.40 West and $58.87 East per MWh, to the cent.
Cumulative margin, 2010-2025
$59.6B
Cumulative margin captured 2010-2025, six corridors
East to ISO-NE cumulative margin, 2010-2025, on 260.1 TWh of exports$20.44B
2025 New England margin: Canada exported at $53.24 while New England retail averaged $155.85$102.60/MWh
Inversion crossover year: western export prices moved above eastern prices and stayed there, peaking at +$51.54 in 20232018
CER 2024 anchor check: pipeline reproduces published West/East prices to the cent$125.40 vs $58.87
Note: Prices in USD. 2026 partial data (through July) is excluded from the annual series. Source: Canada Energy Regulator Electricity Trade Summary (2026-09-25); US EIA Form 861 annual 2010-2025; Bank of Canada FXAUSDCAD; FRED DEXCAUS; computed by the project
powertrade.canada.nshipyard.com
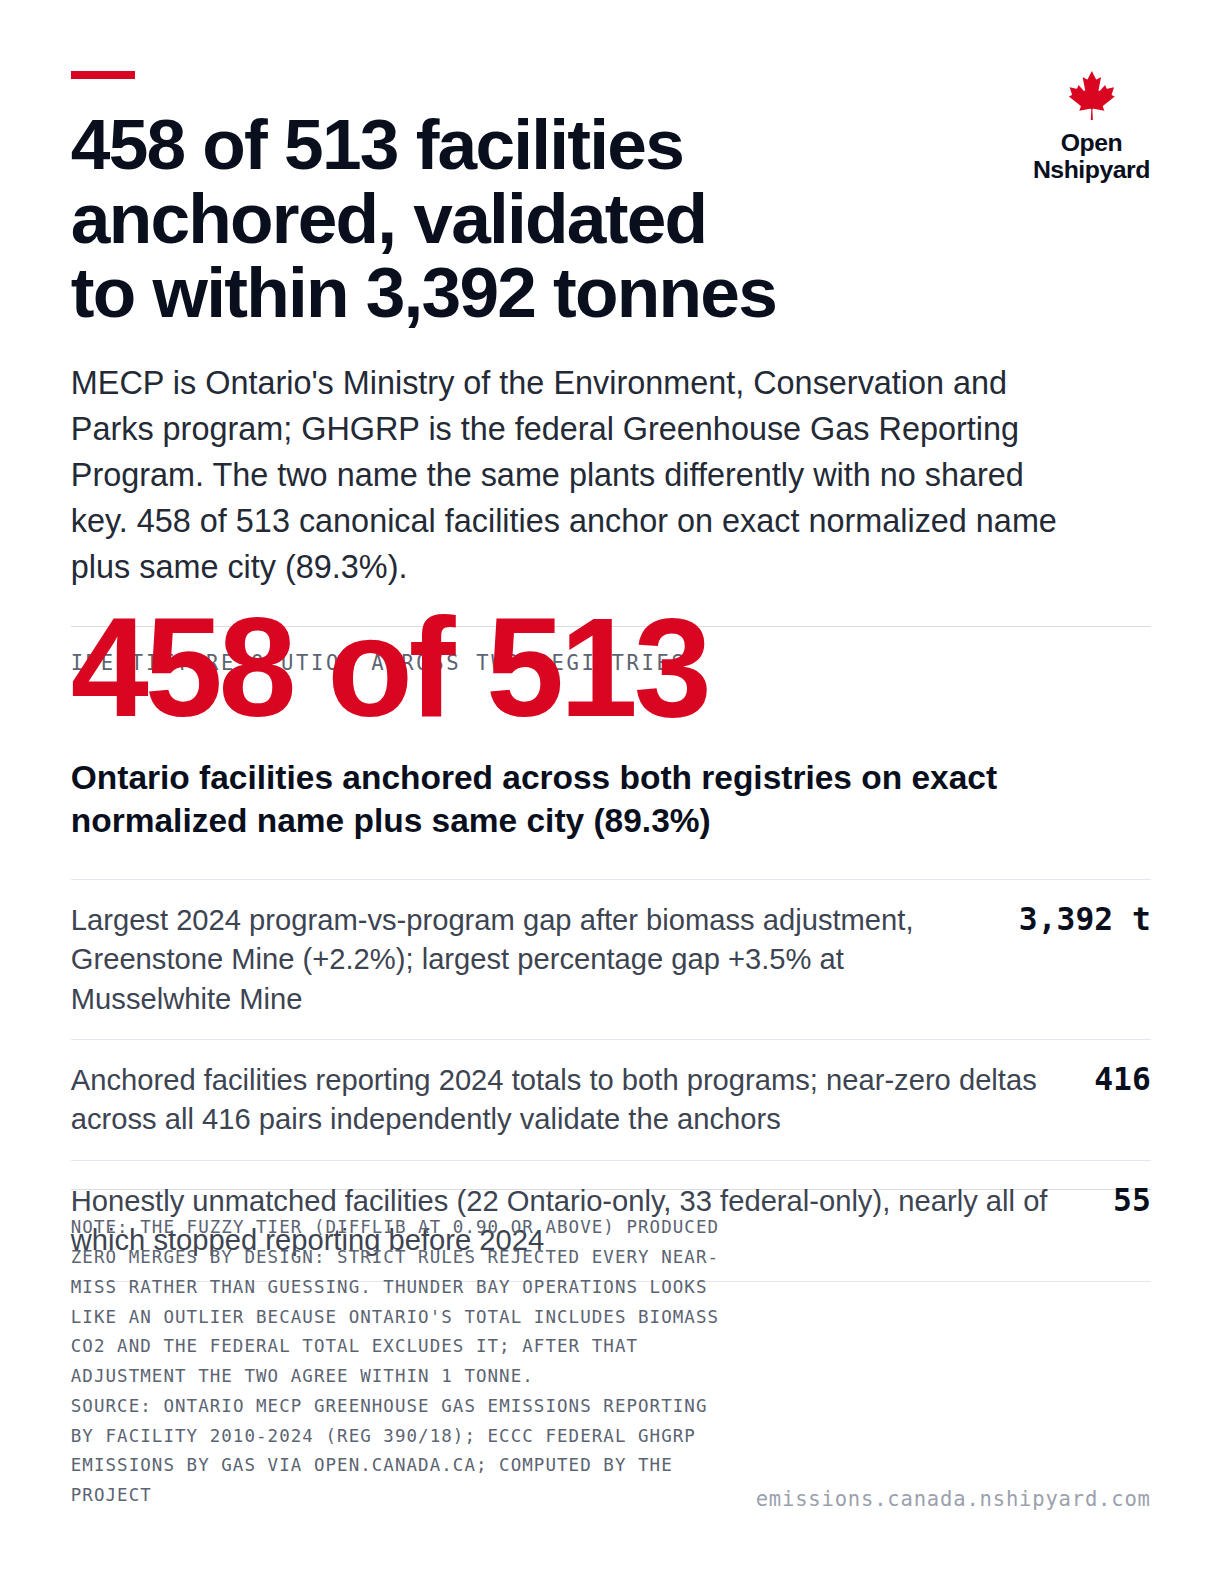
458 of 513 Ontario facilities matched across both emissions registries; worst gap is 3,392 tonnes
Open Nshipyard
MECP is Ontario's Ministry of the Environment, Conservation and Parks program; GHGRP is the federal Greenhouse Gas Reporting Program. The two name the same plants differently with no shared key. 458 of 513 canonical facilities anchor on exact normalized name plus same city (89.3%).
Identity resolution across two registries
458 of 513
Ontario facilities anchored across both registries on exact normalized name plus same city (89.3%)
Largest 2024 program-vs-program gap after biomass adjustment, Greenstone Mine (+2.2%); largest percentage gap +3.5% at Musselwhite Mine3,392 t
Anchored facilities reporting 2024 totals to both programs; near-zero deltas across all 416 pairs independently validate the anchors416
Honestly unmatched facilities (22 Ontario-only, 33 federal-only), nearly all of which stopped reporting before 202455
Note: The fuzzy tier (difflib at 0.90 or above) produced zero merges by design: strict rules rejected every near-miss rather than guessing. Thunder Bay Operations looks like an outlier because Ontario's total includes biomass CO2 and the federal total excludes it; after that adjustment the two agree within 1 tonne. Source: Ontario MECP Greenhouse Gas Emissions Reporting By Facility 2010-2024 (Reg 390/18); ECCC federal GHGRP Emissions by Gas via open.canada.ca; computed by the project
emissions.canada.nshipyard.com
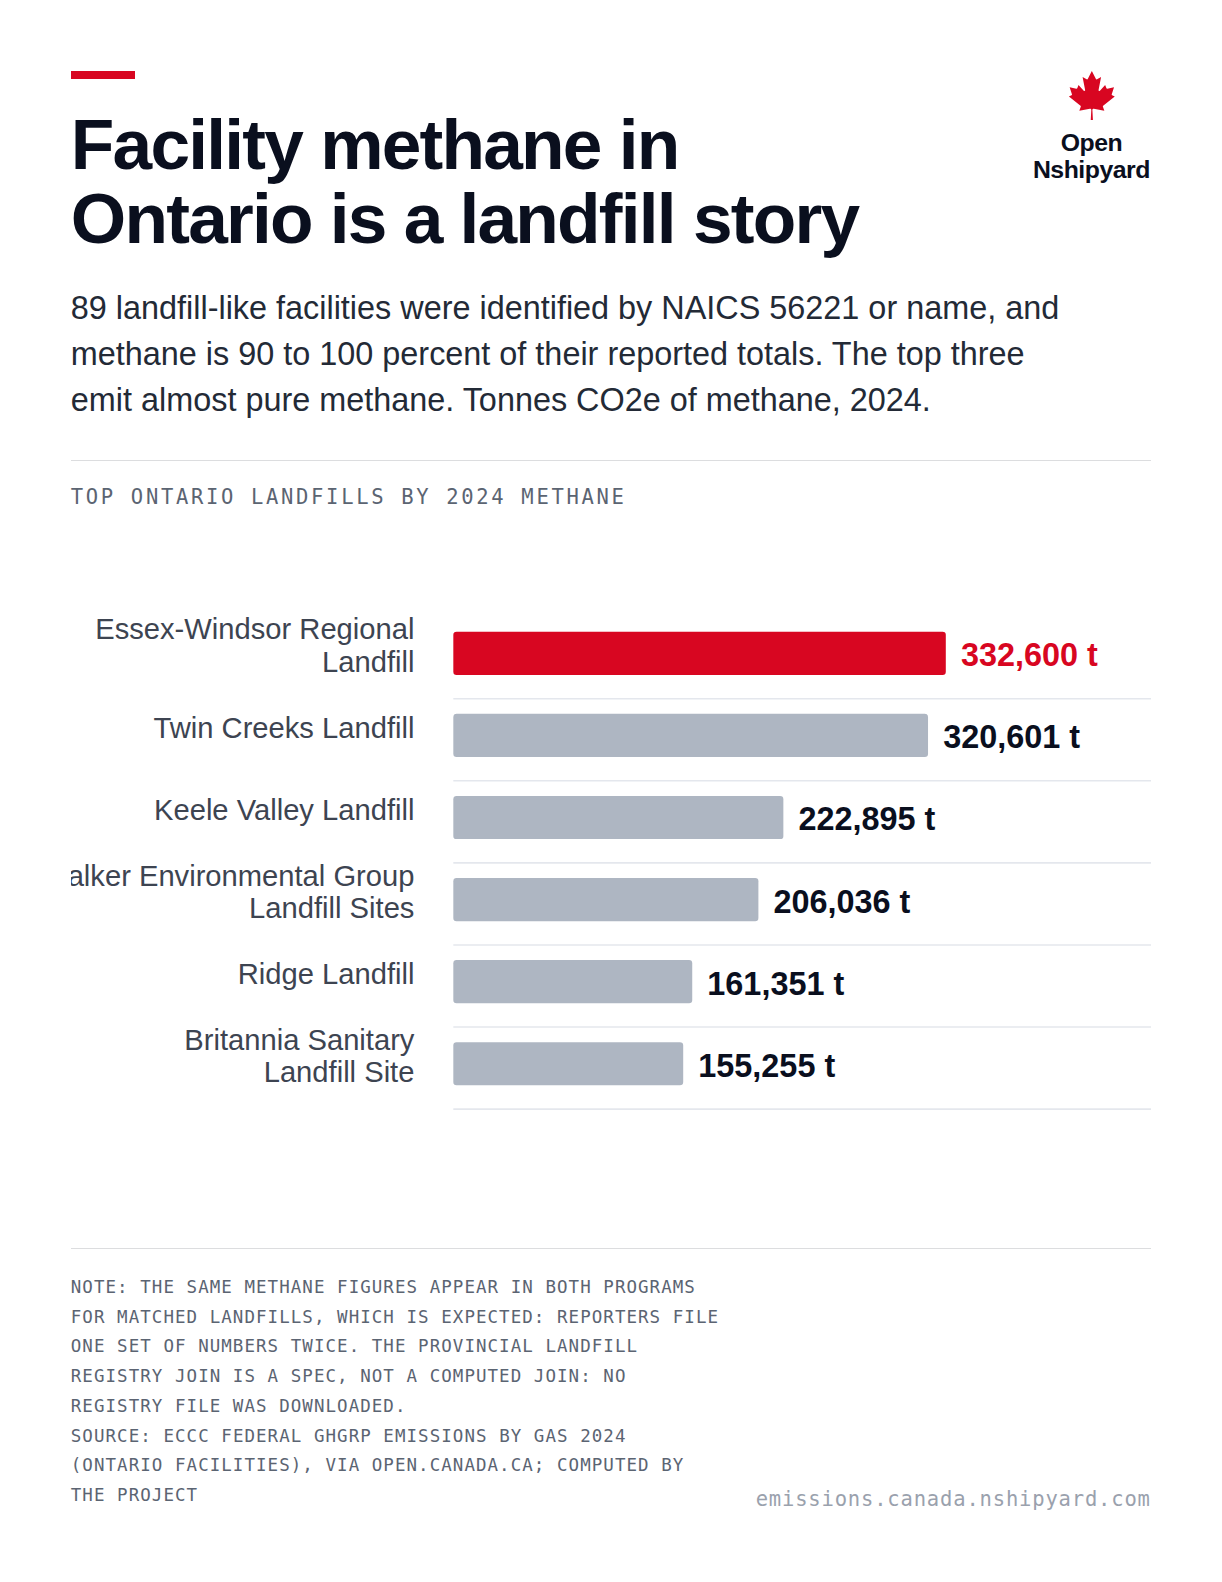
Facility methane in Ontario is a landfill story
Open Nshipyard
89 landfill-like facilities were identified by NAICS 56221 or name, and methane is 90 to 100 percent of their reported totals. The top three emit almost pure methane. Tonnes CO2e of methane, 2024.
Top Ontario landfills by 2024 methane
Note: The same methane figures appear in both programs for matched landfills, which is expected: reporters file one set of numbers twice. The provincial landfill registry join is a spec, not a computed join: no registry file was downloaded. Source: ECCC federal GHGRP Emissions by Gas 2024 (Ontario facilities), via open.canada.ca; computed by the project
emissions.canada.nshipyard.com
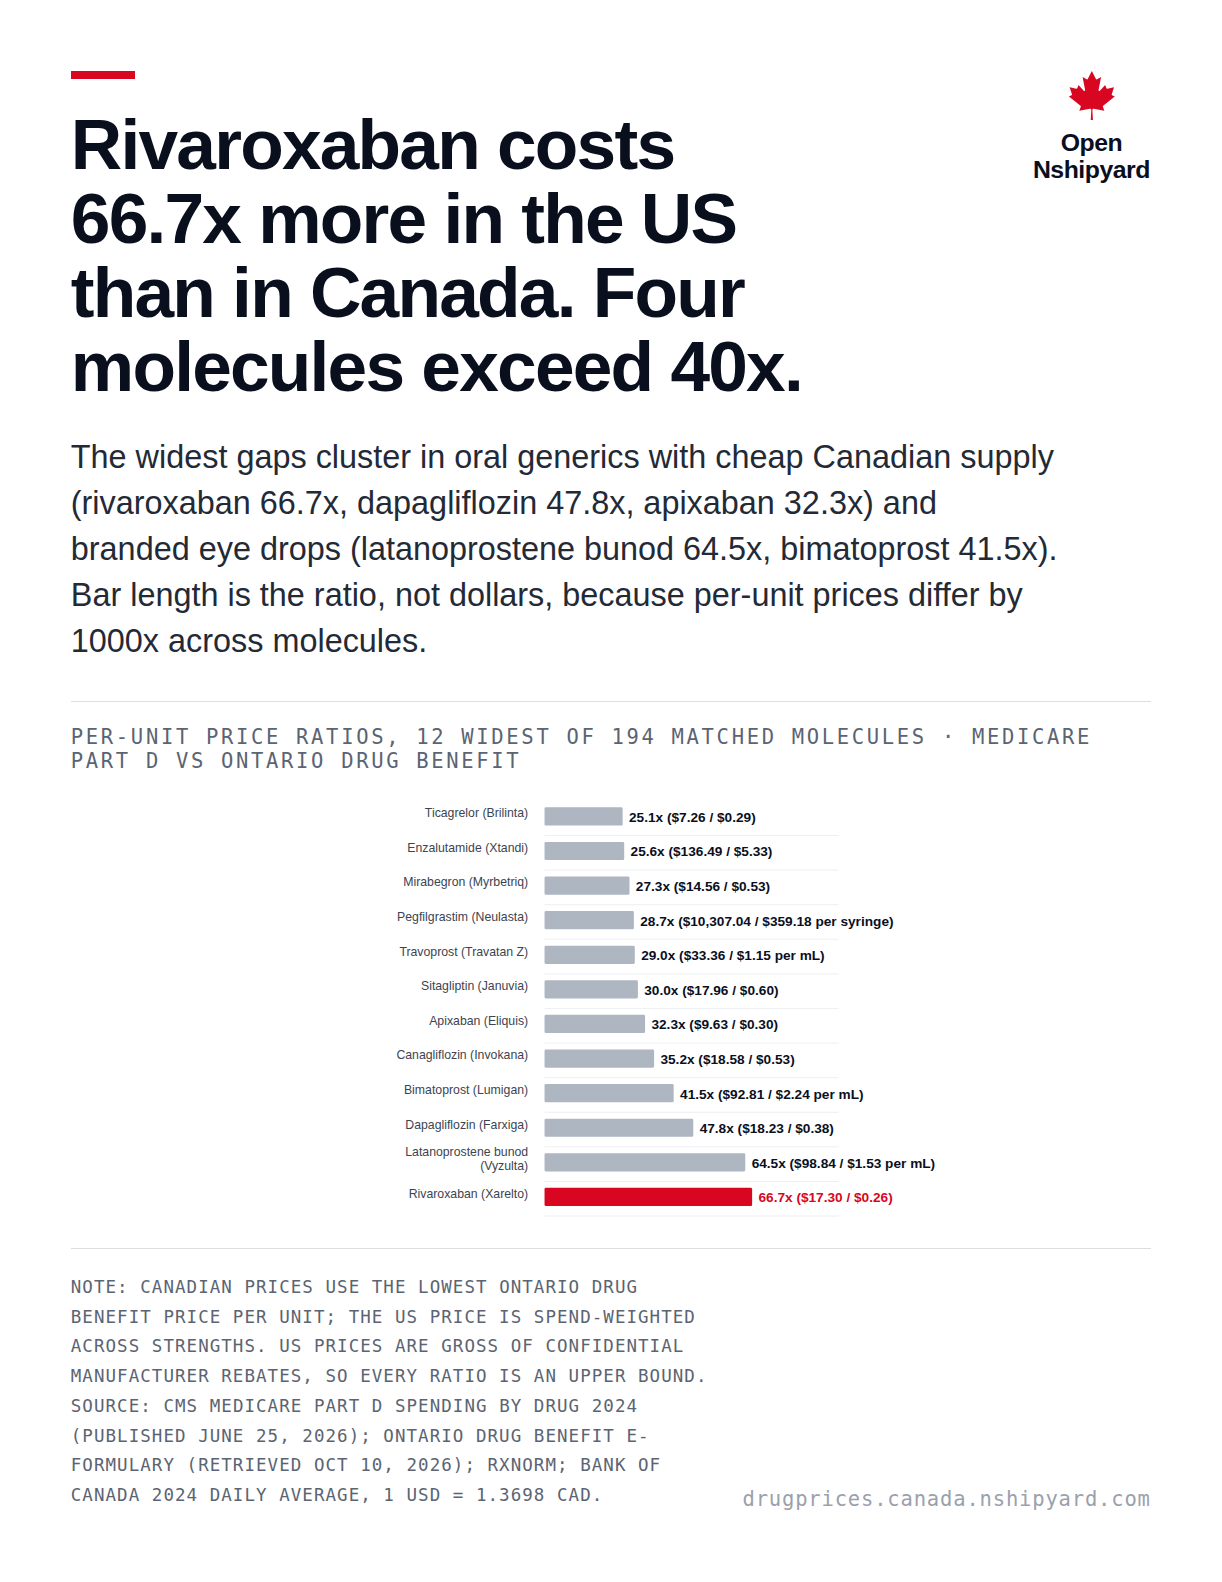
Rivaroxaban costs 66.7x more in the US than in Canada. Four drugs exceed 40x.
Open Nshipyard
The widest gaps cluster in oral generics with cheap Canadian supply (rivaroxaban 66.7x, dapagliflozin 47.8x, apixaban 32.3x) and branded eye drops (latanoprostene bunod 64.5x, bimatoprost 41.5x). Bar length is the ratio, not dollars, because per-unit prices differ by 1000x across drugs.
Per-unit price ratios, 12 widest of 194 matched drugs · Medicare Part D vs Ontario Drug Benefit
Note: Canadian prices use the lowest Ontario Drug Benefit price per unit; the US price is spend-weighted across strengths. US prices are gross of confidential manufacturer rebates, so every ratio is an upper bound. Source: CMS Medicare Part D Spending by Drug 2024 (published June 25, 2026); Ontario Drug Benefit e-formulary (retrieved Oct 10, 2026); RxNorm; Bank of Canada 2024 daily average, 1 USD = 1.3698 CAD.
drugprices.canada.nshipyard.com
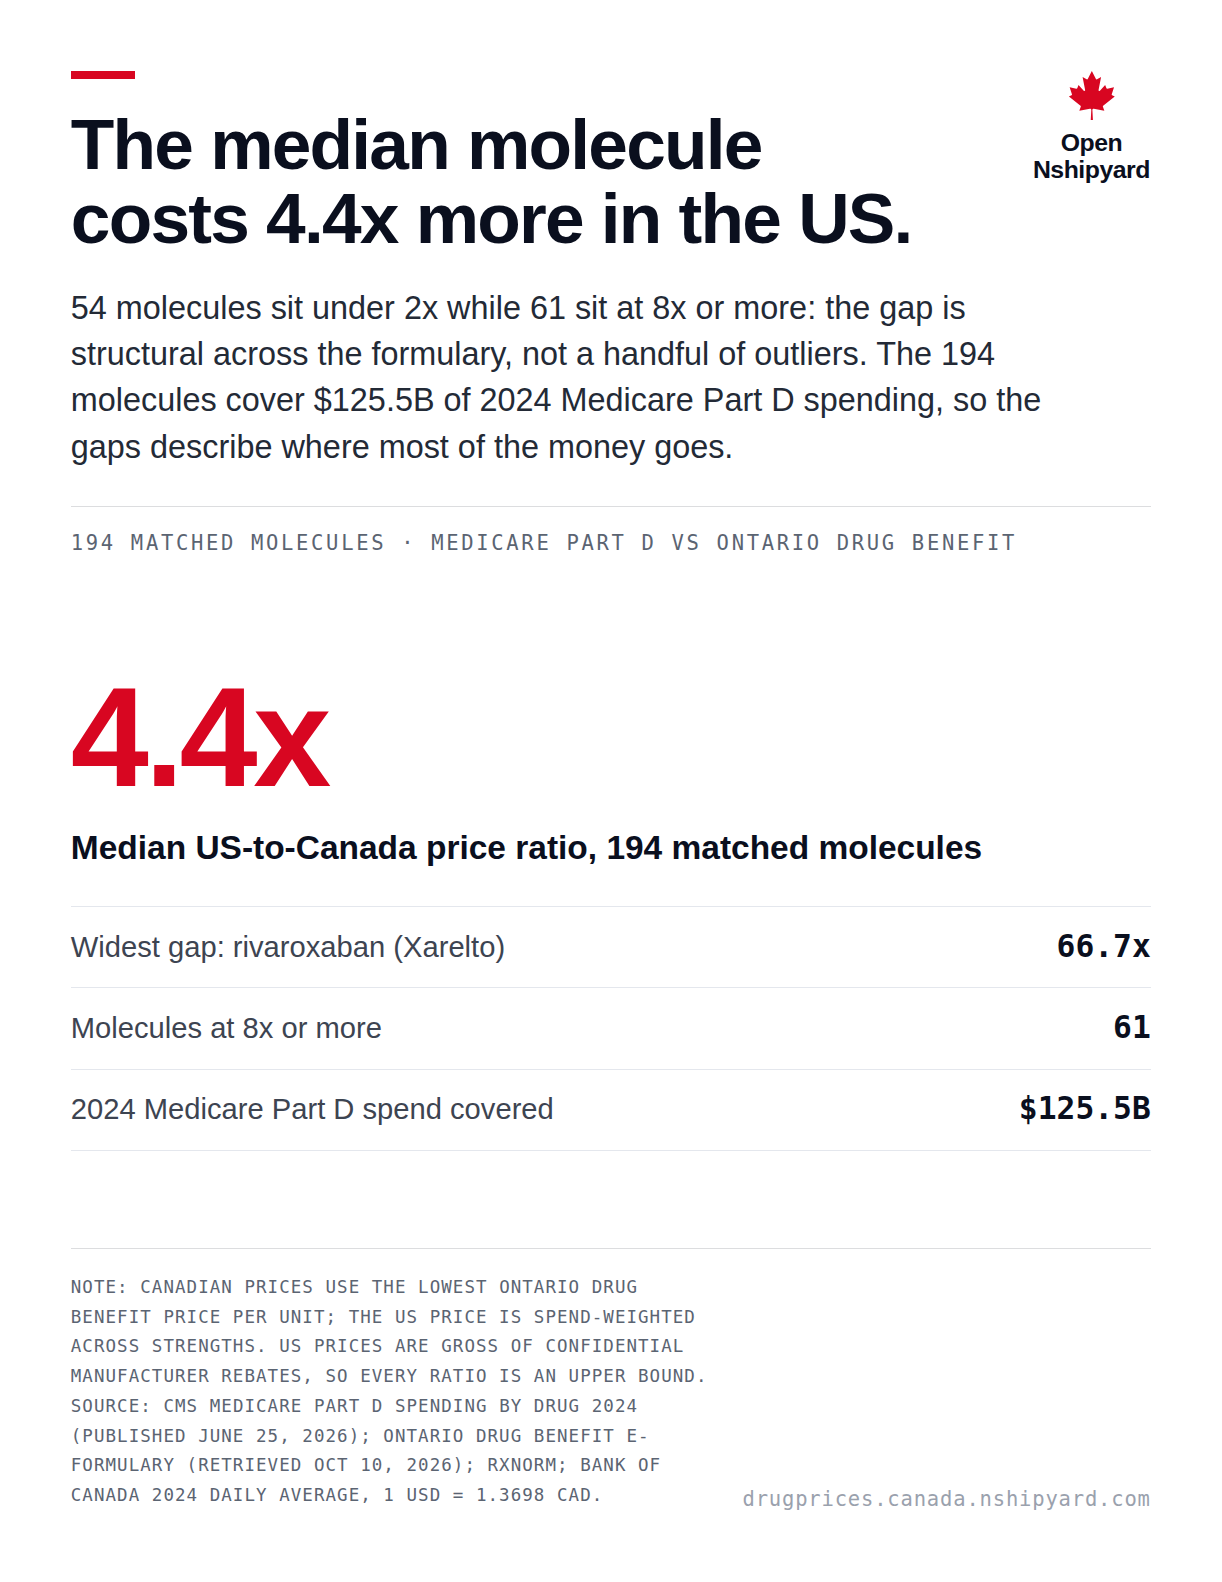
The median drug costs 4.4x more in the US.
Open Nshipyard
54 drugs sit under 2x while 61 sit at 8x or more: the gap is structural across the formulary, not a handful of outliers. The 194 drugs cover $125.5B of 2024 Medicare Part D spending, so the gaps describe where most of the money goes.
194 matched drugs · Medicare Part D vs Ontario Drug Benefit
4.4x
Median US-to-Canada price ratio, 194 matched drugs
Widest gap: rivaroxaban (Xarelto)66.7x
Drugs at 8x or more61
2024 Medicare Part D spend covered$125.5B
Note: Canadian prices use the lowest Ontario Drug Benefit price per unit; the US price is spend-weighted across strengths. US prices are gross of confidential manufacturer rebates, so every ratio is an upper bound. Source: CMS Medicare Part D Spending by Drug 2024 (published June 25, 2026); Ontario Drug Benefit e-formulary (retrieved Oct 10, 2026); RxNorm; Bank of Canada 2024 daily average, 1 USD = 1.3698 CAD.
drugprices.canada.nshipyard.com
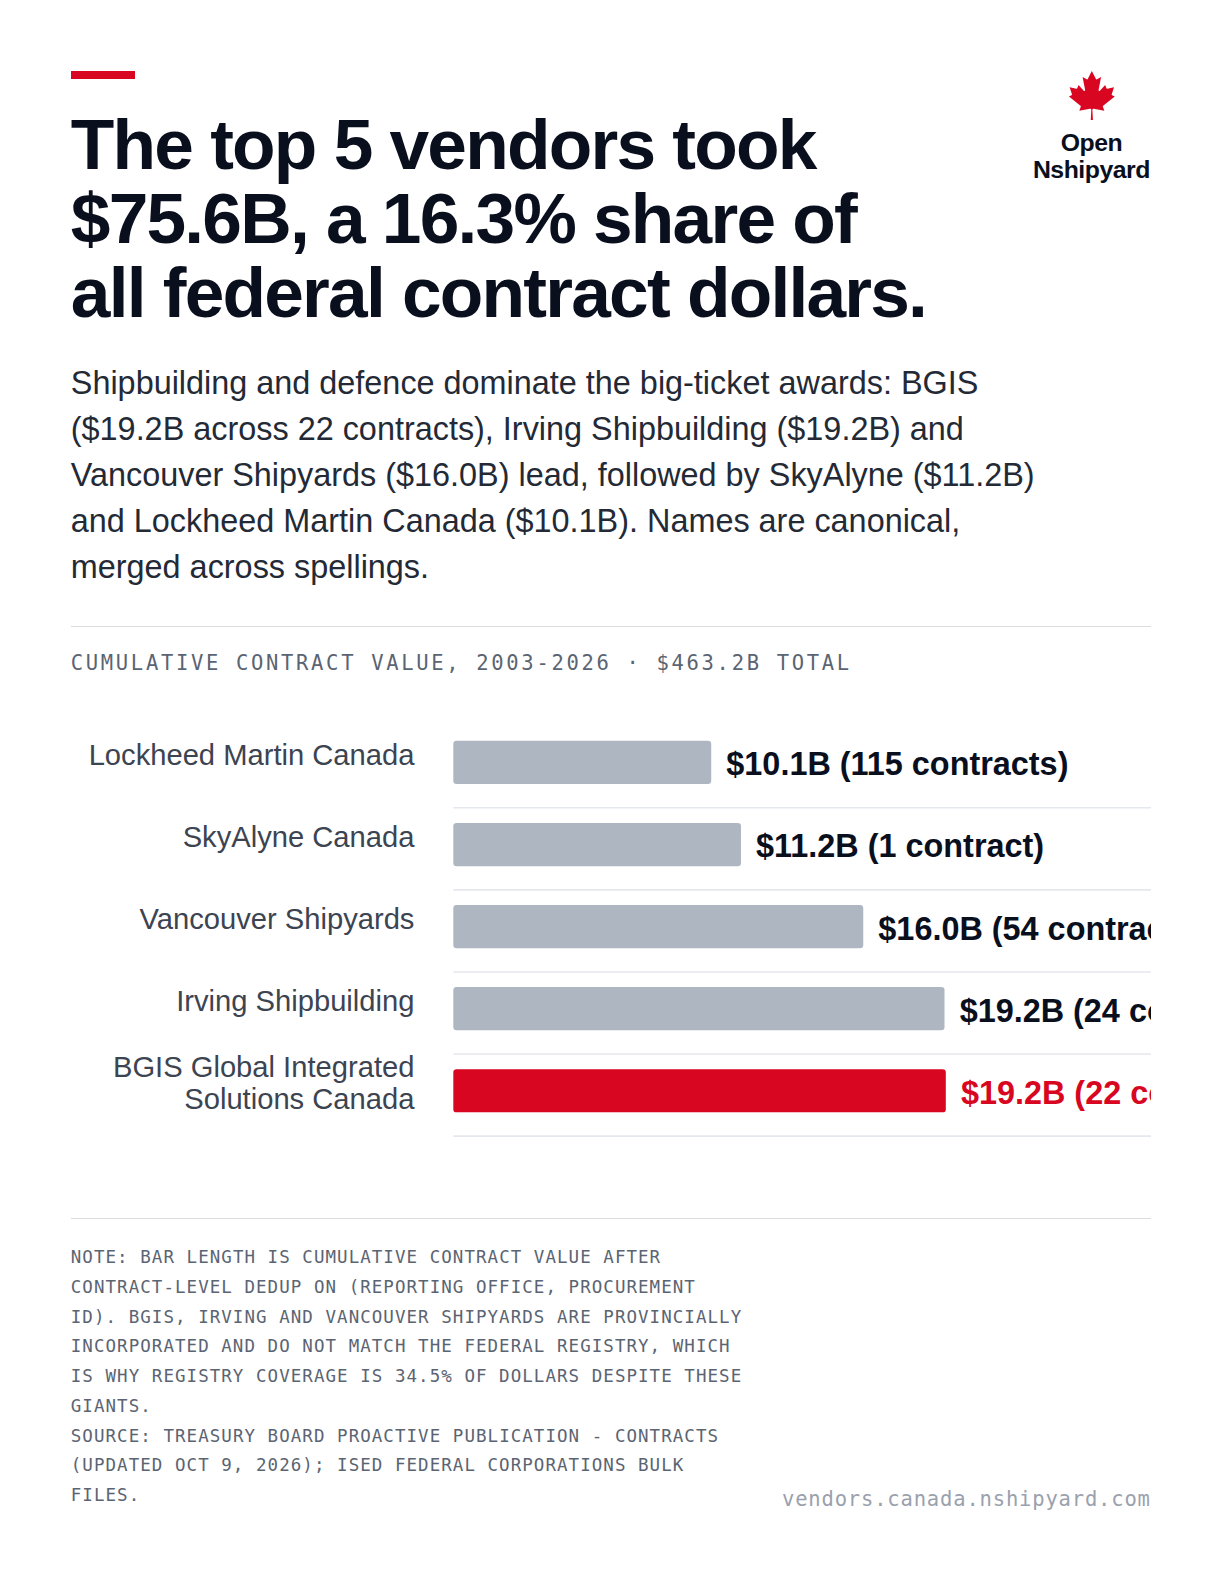
BGIS, Irving Shipbuilding, Vancouver Shipyards, SkyAlyne and Lockheed Martin took $75.6B: 16.3% of all federal contract dollars.
Open Nshipyard
Shipbuilding and defence dominate the big-ticket awards: BGIS ($19.2B across 22 contracts), Irving Shipbuilding ($19.2B) and Vancouver Shipyards ($16.0B) lead, followed by SkyAlyne ($11.2B) and Lockheed Martin Canada ($10.1B). Names are canonical, merged across spellings.
Cumulative contract value, 2003-2026 · $463.2B total
Note: Bar length is cumulative contract value after contract-level dedup on (reporting office, procurement ID). BGIS, Irving and Vancouver Shipyards are provincially incorporated and do not match the federal registry, which is why registry coverage is 34.5% of dollars despite these giants. Source: Treasury Board Proactive Publication - Contracts (updated Oct 9, 2026); ISED Federal Corporations bulk files.
vendors.canada.nshipyard.com
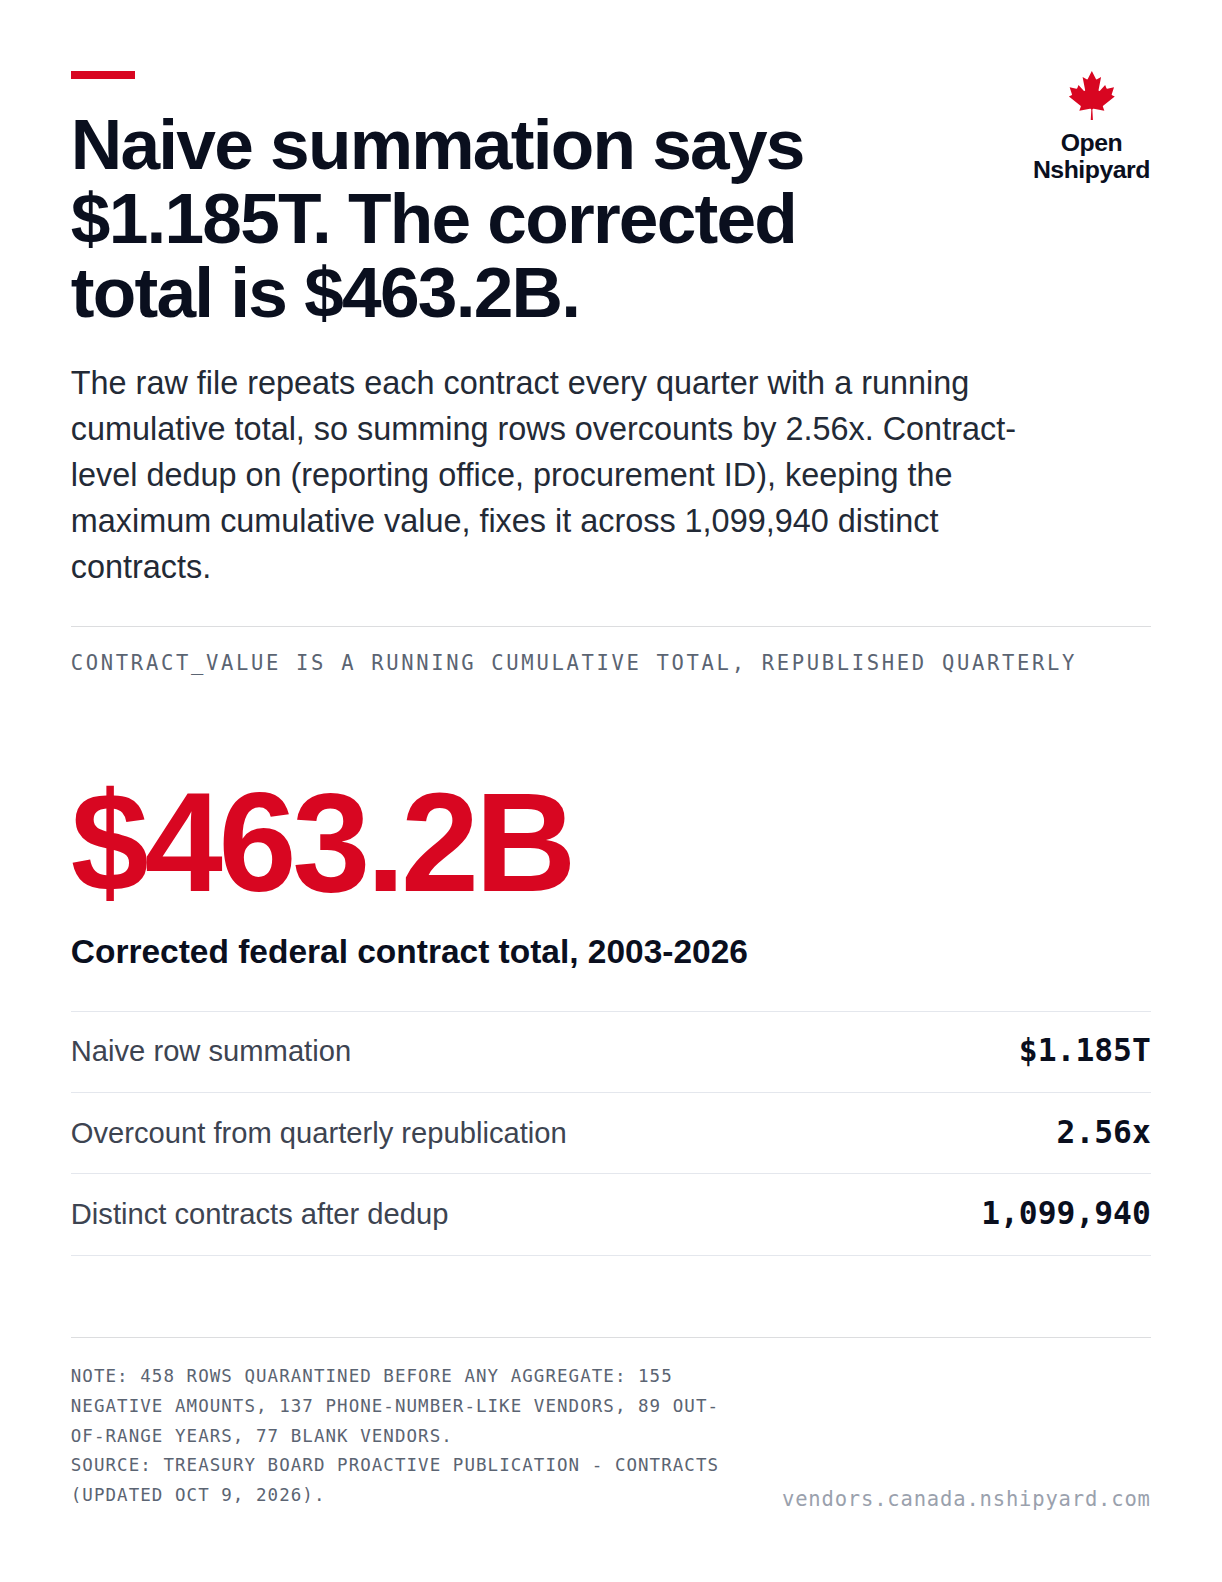
Naive summation says $1.185T. The corrected total is $463.2B.
Open Nshipyard
The raw file repeats each contract every quarter with a running cumulative total, so summing rows overcounts by 2.56x. Contract-level dedup on (reporting office, procurement ID), keeping the maximum cumulative value, fixes it across 1,099,940 distinct contracts.
contract_value is a running cumulative total, republished quarterly
$463.2B
Corrected federal contract total, 2003-2026
Naive row summation$1.185T
Overcount from quarterly republication2.56x
Distinct contracts after dedup1,099,940
Note: 458 rows quarantined before any aggregate: 155 negative amounts, 137 phone-number-like vendors, 89 out-of-range years, 77 blank vendors. Source: Treasury Board Proactive Publication - Contracts (updated Oct 9, 2026).
vendors.canada.nshipyard.com
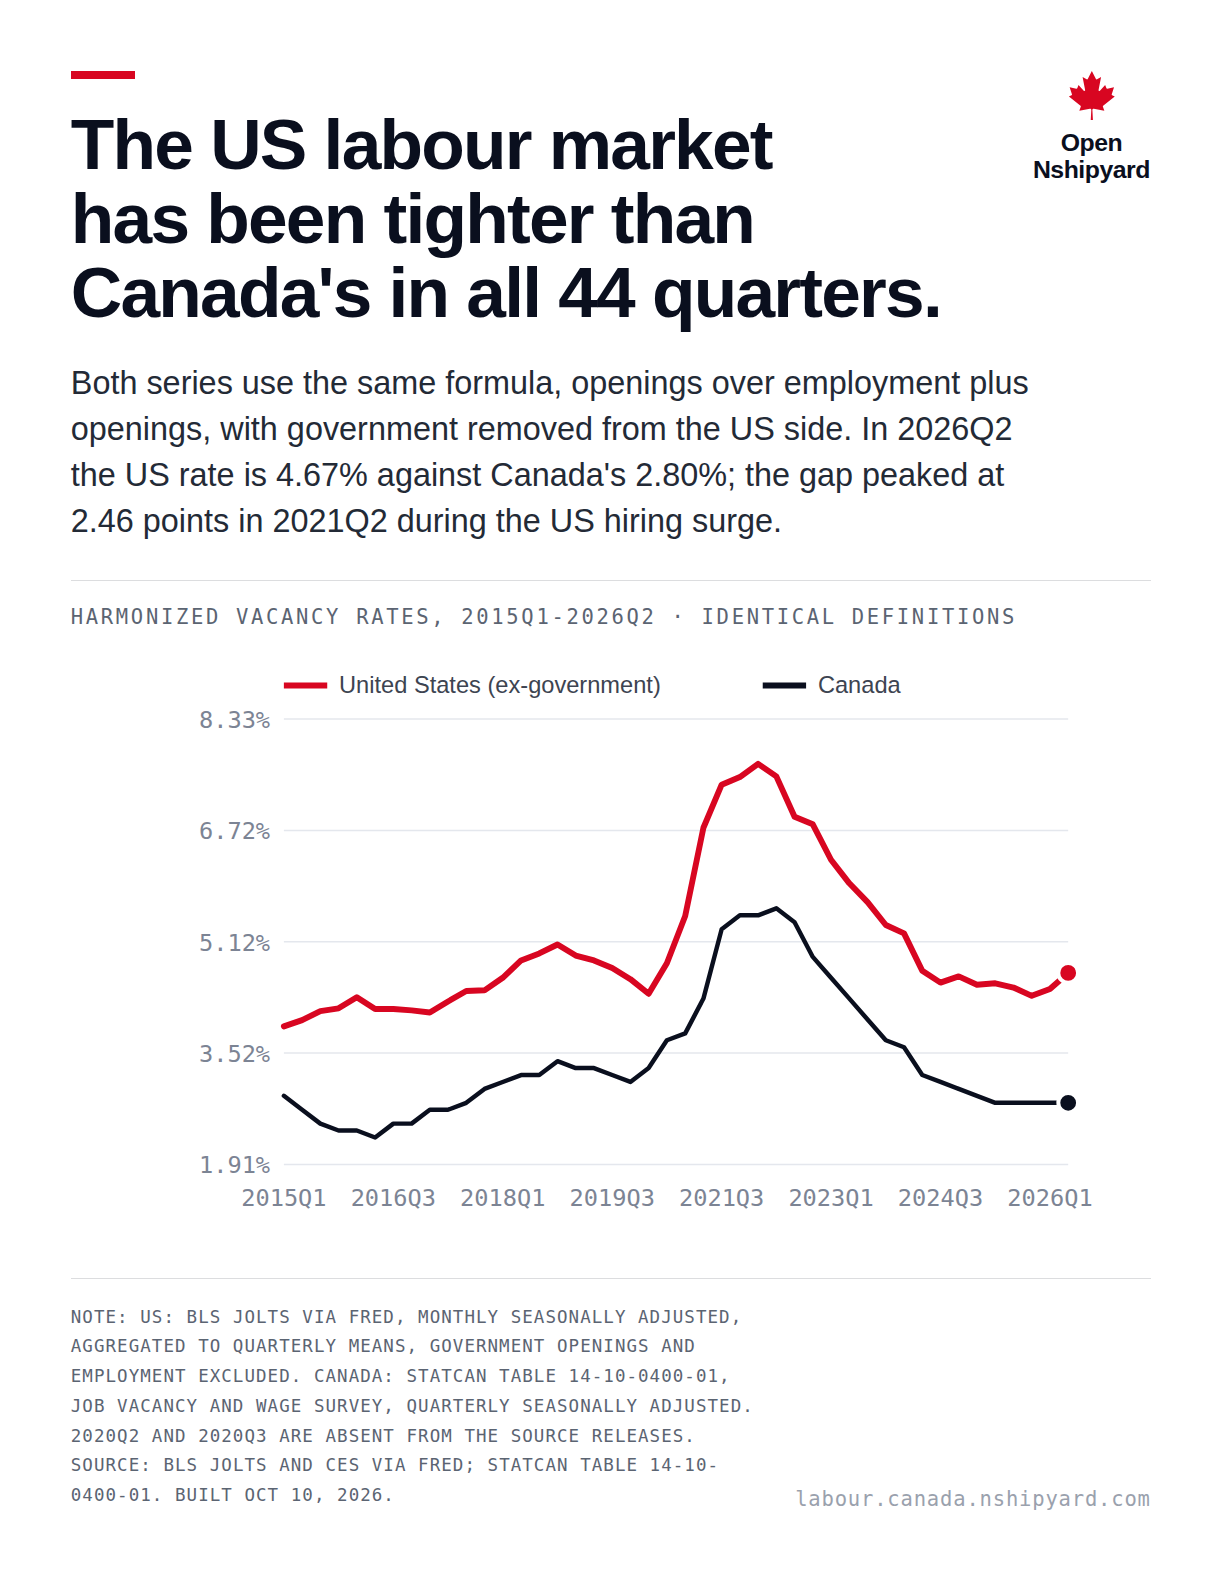
The US labour market has been tighter than Canada's in all 44 quarters.
Open Nshipyard
Both series use the same formula, openings over employment plus openings, with government removed from the US side. In 2026Q2 the US rate is 4.67% against Canada's 2.80%; the gap peaked at 2.46 points in 2021Q2 during the US hiring surge.
Note: US: BLS JOLTS via FRED, monthly seasonally adjusted, aggregated to quarterly means, government openings and employment excluded. Canada: StatCan table 14-10-0400-01, Job Vacancy and Wage Survey, quarterly seasonally adjusted. 2020Q2 and 2020Q3 are absent from the source releases. Source: BLS JOLTS and CES via FRED; StatCan table 14-10-0400-01. Built Oct 10, 2026.