
Open source

An open-source data project. Not affiliated with the Government of Canada or the City of Toronto.

A lively Toronto street at golden hour

Impact

What does this enable?

Governments publish millions of public records that no ordinary person can use. Not because the information is secret, but because nobody cleaned it up. Open Nshipyard does the cleaning, 40 projects and 9M+ records so far, and turns them into answers you can act on. Free, bilingual, with the methods published.

Why this exists

The blockage is rarely secrecy. It is format.

Unexplained codes. The same vendor spelled 6,117 ways. Two files about the same facility that share no key. Tables published but never ranked. We remove the blockage and log every fix on our data-fixes page, so you can check what changed and why instead of taking our word for it.

See the data-fixes log →
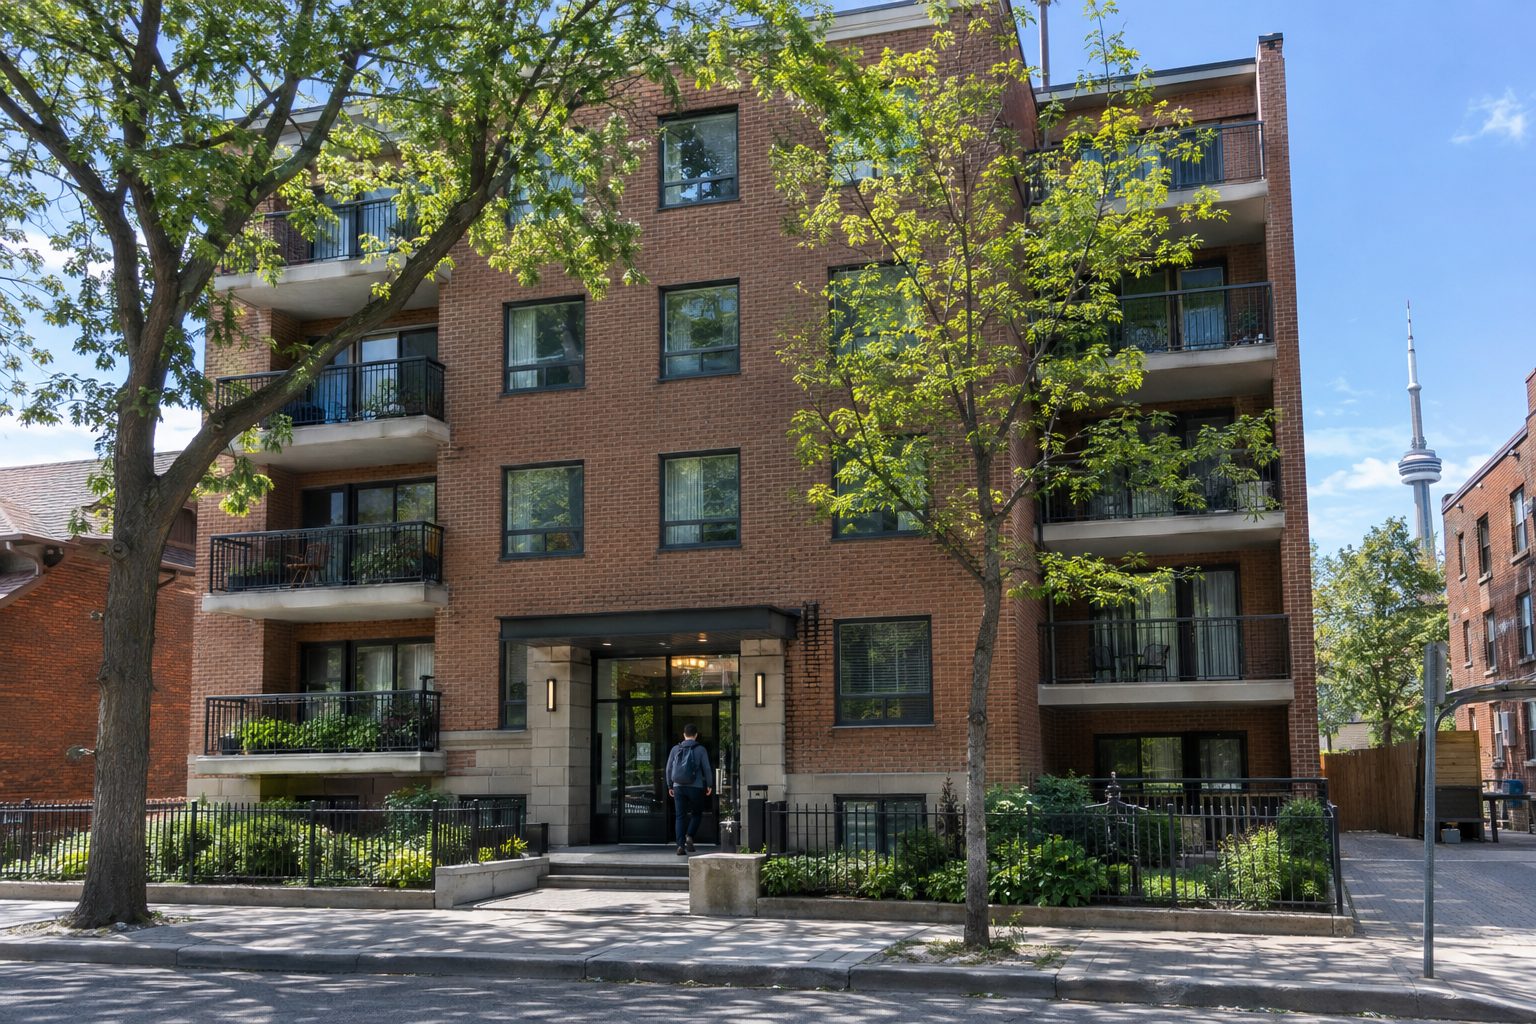
A Toronto apartment building on a clear day

Check a building, a restaurant, or a road before you commit

The problem

RentSafeTO scores lived in one file and the apartment registry in another, so operators could not be ranked. Inspections were published per location, so chains could not be compared. The speed-camera record was never ranked. Parking tickets had addresses but no geography.

What this enables

  • Look up who manages a building and how their portfolio scores. 34 buildings are red-rated; the largest operator runs 104 with zero reds.
  • Compare restaurant chains on inspection failures, normalized for inspection frequency.
  • See every speed-camera site ranked by tickets: one camera wrote 70,243.
  • Type an address for nearby road work and permits. Check rain against 21,983 mapped floods. See live fires against 54 years of history.

The parking cleanup is logged on our data-fixes page.
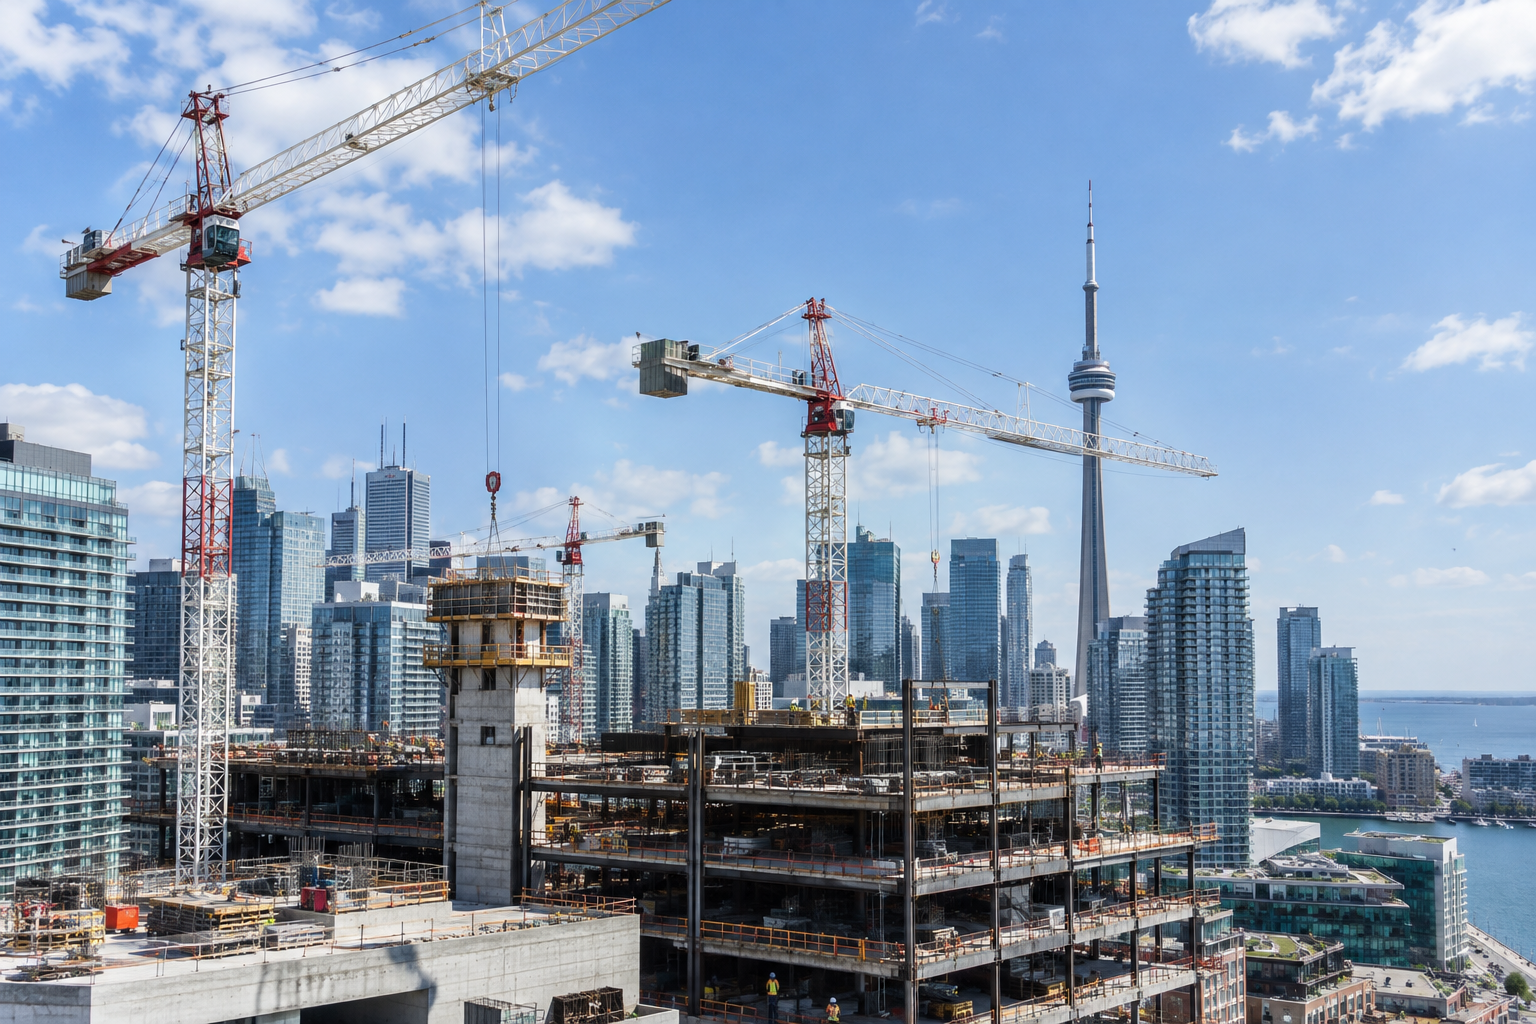
Tower cranes over a Toronto construction site

See who got the public money, and how much

The problem

$21.5B in contracts named vendors in 6,117 spellings, and three award amounts turned out to be phone numbers. Ottawa's AI spending was a headline with no itemization. Nobody published the electricity export margin.

What this enables

  • $21.5B resolved to 4,082 canonical vendors: 90.1% through open competition, $1.8B not.
  • Ottawa's AI spending, contract by contract, each vendor's ownership coded with an evidence link.
  • The $59.6B electricity export margin to the US, corridor by corridor.
  • Fraud ranked by scam type: investment fraud is $1.38B of $2.687B in reported losses.

The procurement cleanup is logged on our data-fixes page.

A pharmacist handing a prescription across a pharmacy counter

Compare drug prices, shortages, and ER waits

The problem

US and Canadian drug prices were never on the same row. Shortage reports were never ranked by company. Ontario published ER wait tables but never a ranking.

What this enables

  • 194 molecules priced in both countries, one row each. The median molecule costs 4.4x more in the US.
  • Three firms hold 49% of critical drug shortages.
  • 159 Ontario ERs ranked on four wait measures over 13 months.

The molecule matching, the ER table rebuild, and the shortage normalization are logged on our data-fixes page.

Printed charts and a laptop on a desk in warm light

Check the number behind the claim

The problem

The AI debate ran on incomparable surveys. The federal AI register listed systems with no costs and no outcomes. Vacancy data used different definitions per country. The GPU gap was asserted, never priced.

What this enables

  • The one AI-adoption question both countries asked the same way, with the bias that flatters Canada stated on the page.
  • 412 federal AI systems with the outcome table intentionally left empty.
  • US and Canadian labour markets on identical definitions, 44 quarters.
  • The GPU premium priced SKU by SKU: 11 to 23% more per hour in Canada.

The construction-cost split is logged on our data-fixes page.

An industrial refinery at dusk

See a facility's carbon and toxic releases together

The problem

The same facility appeared under different names in the carbon registry and the toxics registry, which share no key. Both footprints could never be seen at once.

What this enables

  • 1,879 carbon emitters joined to 24,553 toxic polluters.
  • One oil sands operation tops both lists: 8.0M tonnes of CO2e and 126.1M kg of toxics.
  • 513 Ontario facilities with both registries side by side.

The registry join is logged on our data-fixes page.

Hands organizing printed reports beside a laptop

The cleaning work that makes it all possible

The problem

2.23M 311 requests in 952 free-text types. 37,469 licences with no industry codes. 49,414 pipe segments in unexplained codes. Neighbourhoods published as two vintages with no crosswalk.

What this enables

  • A versioned 311 taxonomy, a licence-to-NAICS join, a watermain codebook, civic code lookups, neighbourhood crosswalks, and a clean permits API.

All of it logged on our data-fixes page: 311, licence, watermain, codebooks, geo, parcel.

Honest about where we are

What we don't claim

No policy has changed because of these projects yet. We are early. What exists today is the evidence layer: cleaned data, published methods, stated caveats. When a decision traces back to this work, it will be listed here, with the receipts.

The record so far

40

projects live or building

9M+

public records cleaned, joined, and documented

15

cleaning jobs logged on the data-fixes page

EN/FR

every project, in both languages

Built by Richardson Dackam in Toronto. Open source. If a number on this page is wrong, the data and the build scripts are public, so you can prove it.